Multivariate Analysis for Process Monitoring | Fault Detection and Diagnosis in Chemical and Petrochemical Processes, Part 1
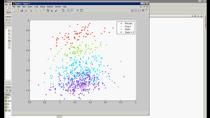
The process industries use big data for not only predictive purposes but also to extract relationships for optimizing a process. Key to big data analysis are multivariate analysis techniques such as principle component analysis (PCA). This is uniquely suited for the analysis and interpretation of process data because it exploits the correlations amongst variables in the data sets. Learn about the applications of multivariate analysis and industrial success stories with MATLAB®.
Published: 21 Jan 2021

Featured Product