Working with Climate IAM Data in MATLAB
Learn how to work with integrated assessment models (IAMs) in MATLAB®. Get an introduction to the concept of IAM models and how to rerun them. See a set of open-source tools that allows you to explore the results of public model runs, such as NGFS, and import the data into MATLAB. Finally, learn how to incorporate this data into the stress testing of a portfolio of loans in the energy sector.
Published: 9 Nov 2021
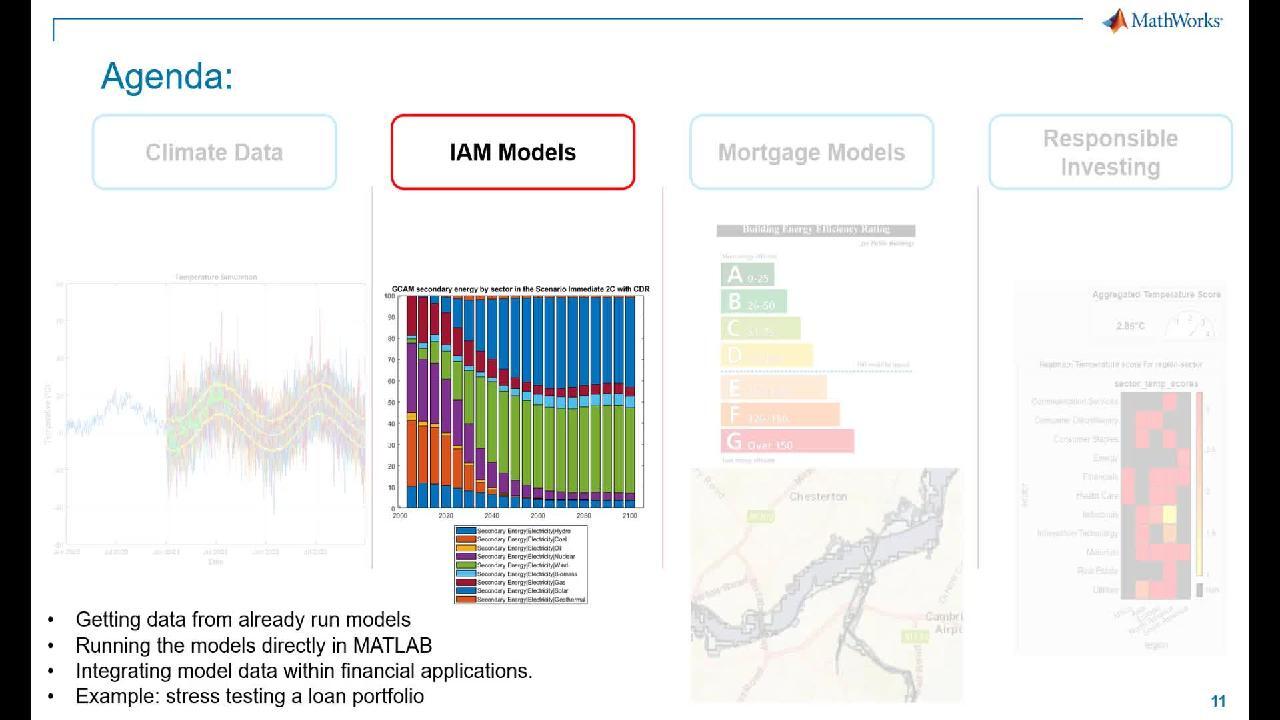
In this second part of the webinar, we look at Integrated Assessment Models. We'll see what is an IAM, how we can run these models within the model of environment, how we can access data from model runs done by different institutions, and finally, how we can integrate the results of these models into a financial application. Specifically, we'll look at three challenges. Understanding and running these IAM models, getting IAM data into MATLAB, and finally, stress testing a loan portfolio using model data or model results.
Before we start, let us look at what is an Integrated Assessment Model. These are type of models that combine very detailed models of our energy system with simplified models of the economy and of the climate. And the goal is to assess the feasibility of achieving climate change, certain climate change goals.
And in this screen, you can see the structure of two of these models, the REMIND and the GCAM, which are some of the more popular ones. And you can see that it's just an integrated system that combines very different systems of our economy. Now each of these models is written by a different group. And it's written in different languages. But most of them provide a way for you to rerun the results with your own parameters or assumptions.
In the case of the GCAM, for example, if you download the executable, you can run them in MATLAB directly just using the run-gcam command. And there's even a interface where you can look at the results. However, you have to be aware that running these models can be quite expensive. And most of the time, people are only interested in looking at the results provided by other institutions.
Because of that, there are many groups and institutions that are running the models and are making the results publicly available over the internet. For example, the Network for Greening the Financial System is an organization contributed by many central banks that provides model results with a set of assumptions and parameters, in the same way that, openENTRANCE, CD-LINKS, IAMC, and others that provide model results on their different set of scenarios and parameters.
To help with this process, the IIASA is a research institute that has collected many of these model results, and how they may have made them available over the public internet via a REST API. On MathWorks we have made available a tool or set of tools through GitHub, that will allow you to explore what is inside these models and even import the data into MATLAB. Now the way this app works is as follows.
First of all, you need to select the environment, or the institution that will provide the results of the models you're about to see. In this case, you see that I have selected the NTFS. Within each of these institutions, you'll see that the IAMs are organized as follows.
First of all, you need to select the model or the set of equations that provide the results that you're going to see. Second, within each of these models, you see that there are several scenarios that you can choose from. And they are the climate change scenarios assumed as an end-goal of the model.
If you want to know exactly what each of those means, you can go to the Information tab. And if, for example, I select the Current Policies scenarios, you'll see that this is just business as usual, or not changing any of the ambition level of the current policies. And I want, for example, Net Zero by 2050, assumes that the global CO2 emissions will be 0 by this year. And therefore, it's a very restrictive scenario.
Now you have to know that each of these environments or each of these institutions have a different set of models. So if I change the environment, the Models and the Scenarios, they might overlap, but they will probably be different between one another. And this just means that the equations they use to evaluate the same problem will be different. So you have to keep in mind that different models will give you different results.
Once selected, Model and Scenario, the next step is to select the Variables. And you'll see that there's many of them that you can choose from. To keep it simple, I'm just going to look at Emissions. And within the Emissions, I'm going to look at the CO2.
Once you selected the variable, if you load the data, you'll see that the data is provided at many different regions. And depending on the model that you're looking at, the granularity will be more or less. So don't assume that you have the same reasons for each of these models.
Now to keep things simple, I'm going to look at, for example, a comparison between the emissions of the US and China, since these are of comparable magnitude. And keep in mind again, that, what you see on screen-- we see that is an increasing emissions that eventually will start to go down-- is a specific model and specific scenario. Now what we observed when building these models is that, most people, when they look at these results, they don't look it as a linear way, like this one.
Instead, they probably know what variable they want. In this case, they just keep it at emissions of CO2. They also probably know what region they want to look at. And keeping it the same, as if we're going to look at the United States, it's highly likely that they, at the beginning, don't know what model or what scenario they want to look at.
That's why we built the second tab, where you can explore the models in a different way and see all the data that is available to you before making any decisions. In this case, for example, you can see how the GCAM model has many different scenarios with matching these strict query, emissions CO2 and the United States. And you can visualize them all at once.
So you can see how, even in the Current Policies scenarios, the overall emissions in CO2, in cubic tons of CO2 per year, are bound to decrease. But most restrictive climate change scenarios, assume that these emissions will eventually start to drop down. Now be on the up, we also provide an API so that this process can also be done with MATLAB.
So on the next step we'll stress test the loan portfolio using climate data. And we use this tool as a way to import data within MATLAB. The purpose behind this example is to show you one application where the results of these climate scenarios are used into a financial application.
This is not a universal solution that fits them all but they're very specific examples. And the exact details can be found on the research paper on the topic, by Professor Irene Monasterolo, Jiani Zheng, and Stefano Battiston. Now the idea here is that, given a portfolio of energy loans, one can use the IAM results in order to assess what would be the impact from moving between one scenario and another.
And it is as follows. Given a loan, the current value of the loan can be calculated as the face value of the loan-- the change in the current value of the loan, excuse me, can be calculated as the face value of the loan times 1 minus the recovery rate and the probability of default. The concept is that the probability of default can be modified, such that, it accounts for the effect of the climate change.
And in order to do that, the authors proposed to use something called, a market share shock. What this is, is the change in market share of the specific variable linked against this loan. So how does it work?
So imagine we're looking at a very specific variable. In this case, I'm going to look at the Secondary Energy Electricity, Coal. This is the total net electricity produced by burning coal. And I'm also going to look at the total net electricity. Production
And when I look at that-- and I can look at it on the different scenarios-- you will see that, on a scenario like the Net Zero 2050, [PAUSES] the energy coming from coal decreases over time and the total electricity actually increases. And therefore, the market share of coal is reduced drastically.
This is also true on the Current Policies scenarios where the market share also is reduced because the total electricity production increases but coal remains the same. But this impact is less. Therefore, there is a shock, or an impact, between moving from this scenario to another one, which is more restrictive.
Now how do we actually do that? So let's look at a specific example, the same that they use in the paper. Imagine we're looking at the region, in this case, Africa, as a goal. And we're looking at the total production of electricity coming from coal. The market share is then defined as follows.
We have the electricity coming from coal over the total electricity. And this will give us the market share under different scenarios. So on the Current Policies, we get an increase. And on the more limiting scenarios, we get a decrease with more or less speed.
I'm using here the LIMITS environment, instead of the NGFS to be consistent with the one that was used within the paper. And you see that the base would be equivalent to the Current Policies scenarios. And these two would be two restrictive sets of policies.
Now once we have the market share, the shock is defined as the impact, or as the change in going from the business as usual scenario, in this case, the blue line, to one of the more restrictive scenarios at a given point in time. So if we look, for example, at 2030, the share would be going from this point here to this point down here, or this one here down here, depending on which scenario we're looking at.
Hence, the shock is defined as the relative change from going from the base scenario to a more restrictive one. And it is easily computed, such that, for each of the scenarios, for each of the restrictive scenarios, we can get the evolution of the shock at every point in time. Now this same process can be applied, for example, using the NGFS scenarios.
So in this case, if we look, for example, at the GCAM model in the European Union, and we look at a scenario like the below 2 degrees, we can see how the market share evolves over different scenarios. So below 2 degrees, you will see, for example, that gas has a very little impact, or the impact of the electricity coming from gas is reduced. While if we look at the Current Policies, you see how gas is actually a very relevant sector.
So these changes in the market share is what's used to calculate the shocks and is what is used to eventually change the probability of default. [PAUSES] And again, if we know the market share, it's a forward to get the shocks over each of these variables.
So as suspected, we see how solar wind have positive shocks, while coal and oil have negative points. Finally, once you have the shocks, the authors propose that, the change in face value of the loan can be adapted to incorporate this value that you see here as defined by the variable u.
And therefore, the idea is that, if you can map each of your loans in your portfolio against a region and against an energy sector, which in this case, you can see I selected coal, you can see what would be the impact on their face value given a climate scenario model and climate scenario. And depending on how risky the scenario, you'll see that the impact or the change in face value will be more or less.
But the whole concept is, it allows you to have some sort of measure on what would be the impact between going from the current business usual scenario to a more restrictive one in a disordered and shocked way. Again, I want to reiterate that this is not a universal solution. This is just an example taken from a research paper, but shows a possible way on how to incorporate this climate assessment models into a financial application.
Finally, just to summarize a bit of what we did in this example. We, first of all, looked at what was an intelligent model, how to run them in MATLAB. We showed how to actually get the data in MATLAB using the tools provided in a GitHub repository. And finally, we showed a simple example and how we can use the data provided by Integrated Assessment Models in order to produce some financial collateral.
Featured Product
MATLAB
Up Next:

Related Videos:


Seleccione un país/idioma
Seleccione un país/idioma para obtener contenido traducido, si está disponible, y ver eventos y ofertas de productos y servicios locales. Según su ubicación geográfica, recomendamos que seleccione: United States.
También puede seleccionar uno de estos países/idiomas:
América
- América Latina (Español)
- Canada (English)
- United States (English)
Europa
- Belgium (English)
- Denmark (English)
- Deutschland (Deutsch)
- España (Español)
- Finland (English)
- France (Français)
- Ireland (English)
- Italia (Italiano)
- Luxembourg (English)
- Netherlands (English)
- Norway (English)
- Österreich (Deutsch)
- Portugal (English)
- Sweden (English)
- Switzerland
- United Kingdom (English)