ploterrcorr
R2026b(To be removed) Plot autocorrelation of error time series
ploterrcorr will be removed in a future release. For more information,
see Transition Legacy Neural Network Code to dlnetwork Workflows.
For advice on updating your code, see Version History.
Syntax
ploterrcorr(error)

ploterrcorr(errors,'outputIndex',outIdx)
Description
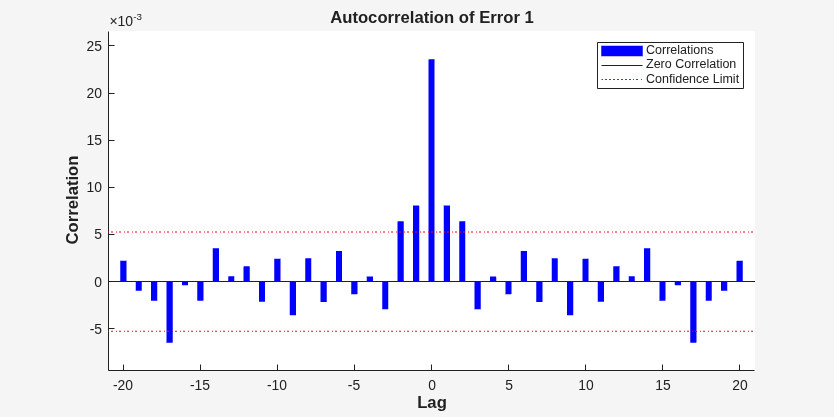
ploterrcorr(error) takes an error time series and plots the
autocorrelation of errors across varying lags. The autocorrelation at zero lag is equal
to the mean-squared error.
ploterrcorr(errors,'outputIndex',outIdx) uses the optional
property name/value pair to define which output error autocorrelation is plotted. The
default is 1.
Examples
Plot Autocorrelation of Errors
Here a NARX network is used to solve a time series problem.
[X,T] = simplenarx_dataset;
net = narxnet(1:2,20);
[Xs,Xi,Ai,Ts] = preparets(net,X,{},T);
net = train(net,Xs,Ts,Xi,Ai);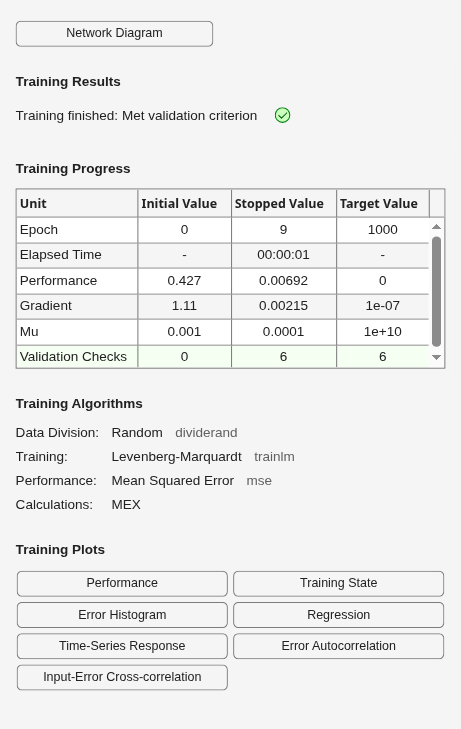
Y = net(Xs,Xi,Ai);
E = gsubtract(Ts,Y);
ploterrcorr(E)
Version History
Introduced in R2010bSee Also
Time Series
Modeler | fitrnet (Statistics and Machine Learning Toolbox) | fitcnet (Statistics and Machine Learning Toolbox) | trainnet | trainingOptions | dlnetwork

