Main Content

fft

Fast Fourier transform (FFT) of iddata object

Description

example

datf = fft(data) uses the fast Fourier transform (FFT) algorithm to transform the time-domain iddata object data to the frequency domain iddata object datf. data contains real-valued signals and has constant sample time Ts, and datf has frequency values equally distributed from 0 to the Nyquist frequency. The Nyquist frequency is included if the signal length is even and not included if the length is odd. To preserve the signal power and noise level, FFTs are normalized by dividing each transform by the square root of the signal length.

example

datf = fft(data,N) specifies the transformation length N. In the default case, the length of the transformation is determined by the signal length. Including N forces the FFT transformations to pad with zeros if the signals in data are shorter than N and truncate the signals otherwise. Thus, the number of frequencies in the real signal case is (N/2)+1 when N is even or (N+1)/2 when N is odd. If data contains several experiments, N can be a row vector of corresponding length.

example

datf = fft(data,N,'complex') specifies to include negative frequencies. For real signals, the default is that datf contains only nonnegative frequencies, while for complex-valued signals, negative frequencies are always included. To enforce negative frequencies in the real case, add 'complex'.

Examples

collapse all

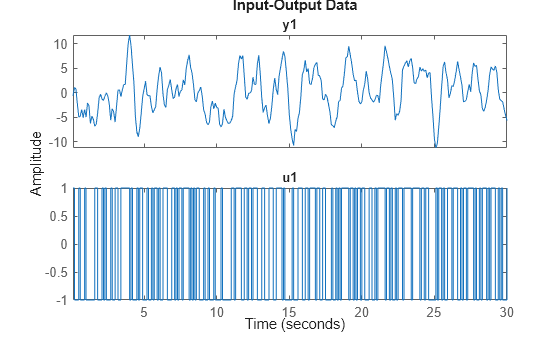
Load and plot the time-domain data z1, which contains 300 samples.

load iddata1 z1;
plot(z1)

Figure contains 2 axes objects. Axes object 1 with title y1 contains an object of type line. This object represents z1. Axes object 2 with title u1 contains an object of type line. This object represents z1.

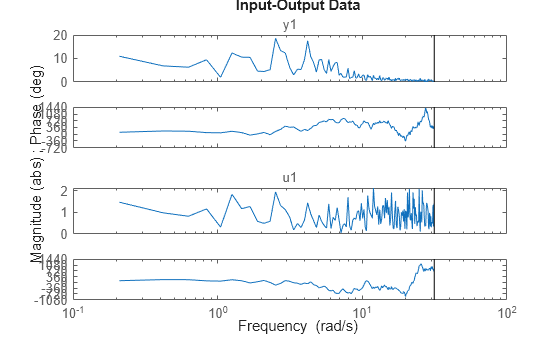
Transform data to the frequency domain and plot.

datf = fft(z1);
plot(datf)

Figure contains 4 axes objects. Axes object 1 with title y1 contains an object of type line. This object represents datf. Axes object 2 contains an object of type line. This object represents datf. Axes object 3 with title u1 contains an object of type line. This object represents datf. Axes object 4 contains an object of type line. This object represents datf.

Load the data. Use fft to transform the time-domain data z1 to the frequency domain, using a transformation length N of 100.

load iddata1 z1;
datf = fft(z1, 100);
plot(datf)

Figure contains 4 axes objects. Axes object 1 with title y1 contains an object of type line. This object represents datf. Axes object 2 contains an object of type line. This object represents datf. Axes object 3 with title u1 contains an object of type line. This object represents datf. Axes object 4 contains an object of type line. This object represents datf.

Load the data. Create 2 frequency-domain objects zf1 and zf2, using 'complex' when creating zf2 to include negative frequencies.

Compare the results.

load iddata1 z1
zf1 = fft(z1,300);
zf2 = fft(z1,300,'complex');
h = plot(zf2,zf1);
legend('zf2','zf1')
opt = getoptions(h);
opt.FreqScale = 'linear';
opt.PhaseMatching = 'on';
setoptions(h,opt)
xlim([-32 32])

Figure contains 4 axes objects. Axes object 1 with title y1 contains 2 objects of type line. These objects represent zf2, zf1. Axes object 2 contains 2 objects of type line. These objects represent zf2, zf1. Axes object 3 with title u1 contains 2 objects of type line. These objects represent zf2, zf1. Axes object 4 contains 2 objects of type line. These objects represent zf2, zf1.

Input Arguments

collapse all

Time-domain data, specified as an iddata object.

Transformation length, specified as a scalar integer, or for multiexperiment data, a row vector of integers. By default, each element of N is equal to the corresponding signal length.

Output Arguments

collapse all

Frequency-domain data, returned as an iddata object.

Tips

fft does not produce the same answer as the base MATLAB® fft function.

  • For real signals, by default, fft computes the FFT for only the positive portion of frequency range. MATLAB fft computes the FFT for the entire frequency range.

  • fft scales the result by 1/sqrt(N), where N is the data length. MATLAB fft does not apply scaling.

Version History

Introduced in R2007a