Contenido principal

colorChecker

R2026b

Calibrite ColorChecker test chart

Description

A colorChecker object stores the positions and measurements of the regions of interest (ROIs) of a Calibrite ColorChecker® Classic test chart (formerly produced by X-Rite® and GretagMacbeth®) [1].

Creation

Description

chart = colorChecker(A) creates a colorChecker object from input image A.

example

chart = colorChecker(A,RegistrationPoints=p) creates a colorChecker object and detects the chart using the registration points in p.

example

chart = colorChecker(___,Name=Value) controls the automatic chart detection and color options by using one or more name-value arguments.

Input Arguments

expand all

Test chart image, specified as an RGB image. This argument sets the Image property.

Data Types: single | double | uint8 | uint16

Coordinates of registration points, specified as a 4-by-2 numeric matrix. The registration points are the plus-shaped (+) fiducials on the outer corners of the chart. Each row of the matrix contains the (x,y) coordinates for one registration point. Specify the points in the order "black", "white", "dark skin", and "bluish green" according to the color of the nearest color patch.

This argument sets the RegistrationPoints property.

Data Types: double

Name-Value Arguments

expand all

Specify optional pairs of arguments as Name1=Value1,...,NameN=ValueN, where Name is the argument name and Value is the corresponding value. Name-value arguments must appear after other arguments, but the order of the pairs does not matter.

Example: chart = colorChecker(A,ReferenceLABWhitePoint="d65") specifies the white point used for the reference L*a*b* values as "d65".

Downsample the chart image for chart detection, specified as a numeric or logical 1 (true) or 0 (false). Downsampling enables colorChecker to detect the chart more quickly.

When true, colorChecker resizes the image while preserving the aspect ratio such that the size of the smallest dimension is 1000. colorChecker uses the downsampled image for detection only. The object calculates all properties using the original image.

You cannot specify this argument when you specify the coordinates of registration points, p.

Since R2026b

Input color space of the test chart image, specified as "srgb", "adobe-rgb-1998", or "prophoto-rgb".

This argument sets the InputColorSpace property.

Since R2026b

Reference values of ROIs in the CIE 1976 L*a*b* color space, specified as a 16-by-3 numeric matrix. The three columns contain the L*, a*, and b* values of the color patches, respectively. The rows contain the reference intensities of the 16 color ROIs, in the same sequential order.

This argument sets the ReferenceLAB property.

Data Types: double

Since R2026b

White point used for the reference L*a*b* values, specified as "d50" or "d65".

This argument sets the ReferenceLABWhitePoint property.

Sensitivity of chart detection, specified as a number in the range [0, 1]. If you set a high sensitivity value, colorChecker detects more points of interest with which to register the test chart image.

You cannot specify this argument when you specify the coordinates of registration points, p.

Data Types: single | double

Properties

expand all

This property is read-only.

Test chart image, specified as an RGB image.

Data Types: single | double | uint8 | uint16

This property is read-only.

Position and intensity values of the color patches, specified as a 24-by-1 vector of structures. Each element in the vector corresponds to one ROI and contains these fields:

FieldDescription
ROI

1-by-4 vector specifying the spatial extent of the ROI. The vector has the form [X Y Width Height]. X and Y are the coordinates of the top-left corner of the ROI. Width and Height are the width and height of the ROI, in pixels. ROI is of data type double.

ROIIntensity

Array of color values within the ROI. The array has dimensions Height-by-Width-by-3. The data type of ROIIntensity matches the data type of the Image property.

Coordinates of registration points, specified as a 4-by-2 numeric matrix. The registration points are the (x,y) coordinates of the plus-shaped (+) fiducials on the outer corners of the chart. Each row of the matrix contains the coordinates for one registration point. Specify the points in the order "black", "white", "dark skin", and "bluish green" according to the color of the nearest color patch.

Data Types: double

Since R2026b

This property is read-only.

Input color space of the test chart image, returned as "srgb", "adobe-rgb-1998", or "prophoto-rgb".

Since R2026b

This property is read-only.

Reference color values of ROIs in the CIE 1976 L*a*b* color space, returned as a 16-by-3 numeric matrix. The three columns contain the L*, a*, and b* values of the color patches, respectively. The rows contain the reference intensities of the 16 color patches, in the same sequential order.

Data Types: double

Since R2026b

This property is read-only.

White point used for the reference L*a*b* color values, returned as "d50" or "d65".

Object Functions

measureColorMeasure color reproduction using test chart
measureIlluminantMeasure scene illuminant using test chart
displayChartDisplay test chart with overlaid regions of interest

Examples

collapse all

Read an image of a ColorChecker® chart into the workspace.

I = imread("colorCheckerTestImage.jpg");

Display the image.

imshow(I)
title("Captured Image of ColorChecker Chart")
text(size(I,2),size(I,1)+15,"Chart courtesy of Calibrite", ...
    FontSize=10,HorizontalAlignment="right")
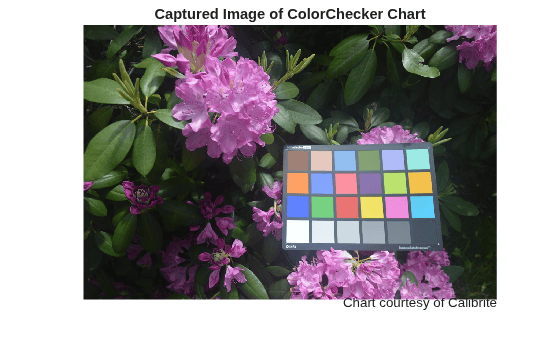
Figure contains an axes object. The hidden axes object with title Captured Image of ColorChecker Chart contains 2 objects of type image, text.

Create a colorChecker object by performing automatic chart detection on the image.

chart = colorChecker(I)
chart = 
  colorChecker with properties:

                     Image: [1024×1541×3 uint8]
           InputColorSpace: "srgb"
        RegistrationPoints: [4×2 double]
              ReferenceLAB: [24×3 double]
    ReferenceLABWhitePoint: "d50"
                 ColorROIs: [24×1 struct]

To confirm that the colorChecker object detected the chart correctly, display the chart and detected ROIs. Each ROI appears as a blue rectangle centered in the appropriate color patch. The registration points appear as red diamonds on the outer corners of the chart.

displayChart(chart)
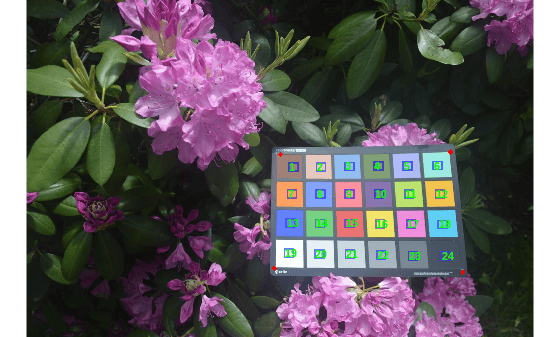
Figure Color checker test chart contains an axes object. The hidden axes object contains 25 objects of type image, text.

Read and display an image of a ColorChecker® chart into the workspace.

I = imread("colorCheckerTestImage.jpg");
imshow(I)

Draw point ROIs that overlap the plus-shaped (+) fiducials at the corners of the chart. Draw the points in the order: Black, White, DarkSkin, BluishGreen.

blackPoint = drawpoint;
whitePoint = drawpoint;
darkSkinPoint = drawpoint;
bluishGreenPoint = drawpoint;
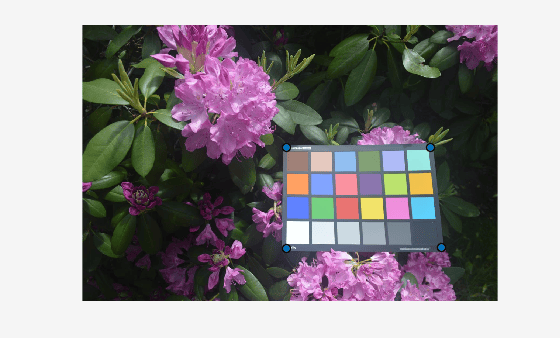
Figure contains an axes object. The hidden axes object contains 5 objects of type image, images.roi.point.

Combine the (x,y) coordinates of the point ROIs into a 4-by-2 matrix.

cornerPoints = [blackPoint.Position;
whitePoint.Position;
darkSkinPoint.Position;
bluishGreenPoint.Position];

Create a colorChecker object by specifying the (x,y) coordinates of the corner registration points.

chart = colorChecker(I,RegistrationPoints=cornerPoints);

To confirm that the colorChecker object detected the chart correctly, display the chart and detected ROIs.

displayChart(chart)
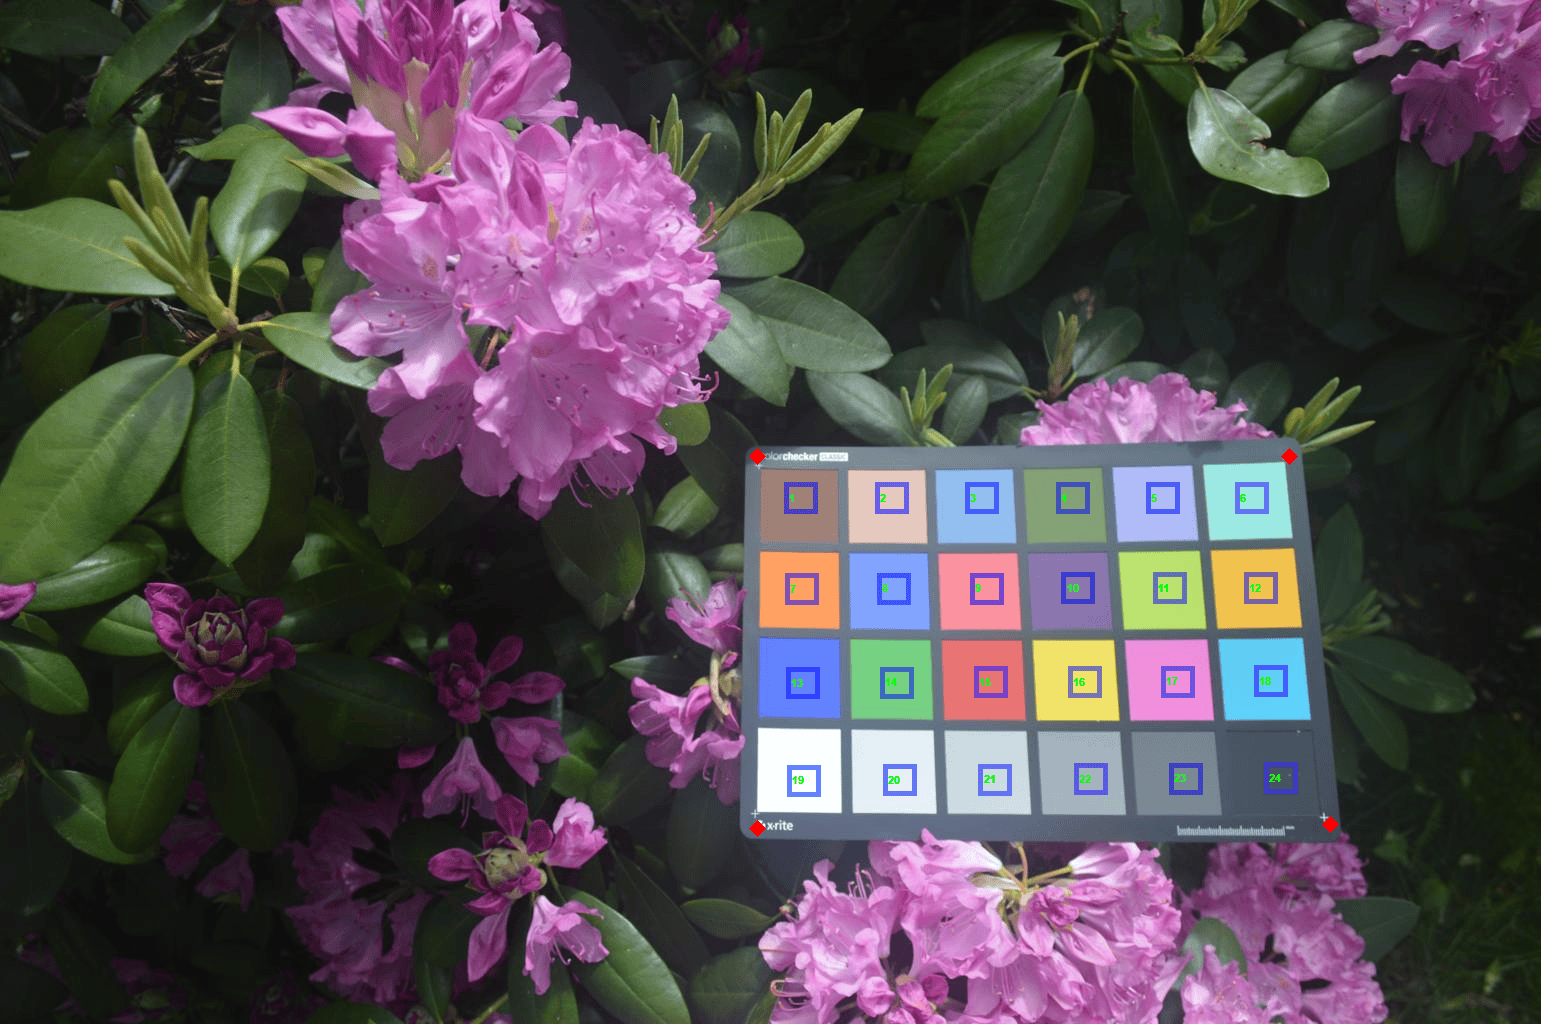
Figure Color checker test chart contains an axes object. The hidden axes object contains 25 objects of type image, text.

Tips

  • There are two manufactured versions of the ColorChecker test chart that have slightly different reference values. The default reference values of the colorChecker object match the "After November 2014" version of the chart. The actual reference values for your chart can vary depending on several factors, such as the manufactured version and print quality. For more accurate color reproduction measurements, specify the reference color values for your chart.

References

[1] Calibrite. "ColorChecker Classic". https://calibrite.com/us/product/colorchecker-classic/.

[2] Fernandez, P. D. M., F. A. Guerrero-Peña, T. I. Ren, and G. J. J. Leandro, "Fast and robust multiple ColorChecker detection using deep convolutional neural networks," Image and Vision Computing, Volume 81, 2019, pp. 15-24.

Version History

Introduced in R2020b

expand all