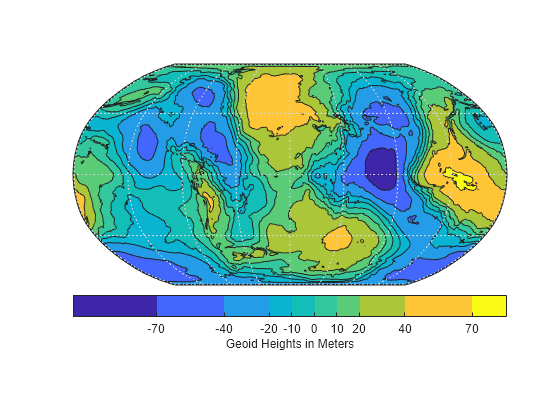
contourcbar
Color bar for filled contour map display
Syntax
Description
Add Color Bar
contourcbar displays a vertical color bar to the right of the
current axes. Color bars display the current colormap and indicate the mapping of data
values into the colormap. If the current axes contains a contour object created by the
contourm, contourfm,
contour3m, or geoshow function, then the
contourcbar function breaks the colormap into sections that
correspond to the contour levels in the plot. Otherwise, the color bar displays the
current colormap.
contourcbar(___,
modifies the color bar appearance using one or more name-value arguments, in addition to
any combination of input arguments from the previous syntaxes. For example,
Name,Value)"Direction","reverse" reverses the color scale.
contourcbar( adds a color
bar to the axes specified by ax,___)ax. Specify the target axes as the first
argument in any of the previous syntaxes.
c = contourcbar(___) returns the ColorBar object.
Remove Color Bar
contourcbar("off") deletes all color bars associated with the
current axes.
contourcbar( deletes all color bars
associated with the target axes.ax,"off")
Examples
Input Arguments
Name-Value Arguments
Tips
The
contourcbarfunction supports the same syntaxes and options as thecolorbarfunction.If the axes contains multiple contour objects created by the
contourm,contourfm,contour3m, orgeoshowfunction, then thecontourcbarfunction divides the color bar into sections using the first contour object it finds in the axes.To add a text description along the color bar, access the underlying text object using the
Labelproperty of the color bar.c.Label.String = "My Colorbar Label";To change the label appearance, such as the font style or color, set other text properties. For a list of properties, see Text Properties. For example, this code changes the font size.
c.Label.FontSize = 12;
Adding a color bar might resize the axes to accommodate the color bar.
If an axes does not exist, then the
contourcbarfunction creates a blank axes and displays a color bar with the default colormap.

