Main Content

sampleStartGoal

Sample start and goal states for motion planning

Since R2024a

Description

[startState,goalState] = sampleStartGoal(stateValidator) selects a valid start and goal state from an input map environment. By default, the function makes a maximum of 100 attempts to select the states.

example

[startState,goalState] = sampleStartGoal(stateValidator,numStates) specifies the number of valid start and goal states to select from an input map environment. By default, the function makes a maximum of 100 attempts to select the specified number of states. If the function is not able to find the specified number of states within 100 attempts, it returns the states that are identified.

example

[___] = sampleStartGoal(stateValidator,numStates,maxAttempts) specifies the maximum number of attempts to select the specified number of start and goal states. Use this syntax to increase the maximum number of attempts in order to get the desired number of states.

Examples

collapse all

Set the seed value to generate repeatable results.

rng("default")

Load a vehicleCostMap object, which contains the input map environment for motion planning.

load sampleMapData.mat

Define the lower and upper limits of the state space variables x, y, and theta from the costmap. The values of the state bounds must be close to or same as that of the map limits.

x = [0 30];
y = [0 30];
theta = [-pi pi];
StateBounds = [x; y; theta];

Create a state space SE(2) object using the specified state space variables. Check the validity of states in the input state space by using validatorVehicleCostmap.

ss= stateSpaceSE2(StateBounds);
sv = validatorVehicleCostmap(ss,Map=map);

Select a start state and goal state by using the sampleStartGoal function.

[start, goal] = sampleStartGoal(sv)
start = 1×3

    8.3549   16.4064    2.8746

goal = 1×3

   20.3621   22.7322    1.5276

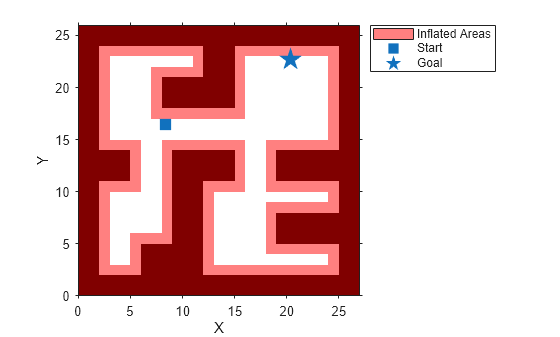
plot(map)
legend(Location="BestOutside")
hold on
plot(start(:,1),start(:,2),plannerLineSpec.start{:})
plot(goal(:,1),goal(:,2),plannerLineSpec.goal{:})
hold off

Figure contains an axes object. The axes object with xlabel X, ylabel Y contains 4 objects of type image, patch, line. One or more of the lines displays its values using only markers These objects represent Inflated Areas, Start, Goal.

Set the seed value to generate repeatable results.

rng(5,"twister")

Load a probability occupancy grid into the MATLAB® workspace.

load("exampleMaps.mat","simpleMap");

Create an occupancy map from the input occupancy grid.

map = occupancyMap(simpleMap);

Define the lower and upper limits of the state space variables x, y, and theta from the occupancy map.

x = map.XWorldLimits;
y =  map.YWorldLimits;
theta = [-pi pi];

Create a state space SE(2) object using the specified state variables.

stateSpace = stateSpaceSE2([x; y; theta]);

Check the validity of the states in the input state space by using a state validator.

stateValidator = validatorOccupancyMap(stateSpace,Map=map);

Select the start point and the goal point in the input state space. Specify the number of states to select as 3.

[startStates,goalStates] = sampleStartGoal(stateValidator,3);

Plot the start points and the goal points by using the plannerLineSpec.start and plannerLineSpec.goal functions, respectively.

fig1 = figure(Position=[0,0,1200,300]);
for cnt = 1:3
    start = startStates(cnt,:);
    goal = goalStates(cnt,:);    
    subplot(1,3,cnt,Parent=fig1)
    show(map)
    hold on
    plot(start(1),start(2),plannerLineSpec.start{:});
    plot(goal(1),goal(2),plannerLineSpec.goal{:});
    hold off
    legend
end

Figure contains 3 axes objects. Axes object 1 with title Occupancy Grid, xlabel X [meters], ylabel Y [meters] contains 3 objects of type image, line. One or more of the lines displays its values using only markers These objects represent Start, Goal. Axes object 2 with title Occupancy Grid, xlabel X [meters], ylabel Y [meters] contains 3 objects of type image, line. One or more of the lines displays its values using only markers These objects represent Start, Goal. Axes object 3 with title Occupancy Grid, xlabel X [meters], ylabel Y [meters] contains 3 objects of type image, line. One or more of the lines displays its values using only markers These objects represent Start, Goal.

Set the seed value to generate repeatable results.

rng(2,"twister")

Load a 3-D occupancy map of a city block into the workspace. Specify a threshold for which cells to consider as obstacle-free.

mapData = load('dMapCityBlock.mat');
omap = mapData.omap;
omap.FreeThreshold = 0.5;

Inflate the occupancy map to add a buffer zone for safe operation around the obstacles.

inflate(omap,1)

Create an SE(3) state space object with bounds for state variables.

ss = stateSpaceSE3([-20 220;
    -20 220;
    -10 100;
    inf inf;
    inf inf;
    inf inf;
    inf inf]);

Create a 3-D occupancy map state validator using the created state space.

sv = validatorOccupancyMap3D(ss);

Assign the occupancy map to the state validator object.

sv.Map = omap;

Select the start and goal states from the input map. Specify the number of start and goal states to select as 5.

[start,goal] = sampleStartGoal(sv,5);

Visualize the results.

show(omap)
hold on
scatter3(start(:,1),start(:,2),start(:,3),'g','filled')
scatter3(goal(:,1),goal(:,2),goal(:,3),'r','filled')
legend("Map","Start states","Goal states",Location="southoutside");
hold off

Figure contains an axes object. The axes object with title Occupancy Map, xlabel X [meters], ylabel Y [meters] contains 3 objects of type patch, scatter. These objects represent Map, Start states, Goal states.

Input Arguments

collapse all

State validator containing the input map environment, specified as a validatorVehicleCostmap, validatorOccupancyMap, validatorOccupancyMap3D, manipulatorCollisionBodyValidator (Robotics System Toolbox) object, or a subclass of nav.StateValidator object.

Number of valid start and goal states to select for motion planning, specified as a positive integer.

Data Types: double

Maximum number of attempts the function can take to select the start and goal states, specified as a positive integer.

Data Types: single | double | int8 | int16 | int32 | int64 | uint8 | uint16 | uint32 | uint64

Output Arguments

collapse all

Start state for motion planning, returned as a M-by-N matrix. M is the number of start states selected for motion planning and N is the number of state variables.

  • If the input is a state validator object with SE(2) state space, the function returns the start state as a M-by-3 matrix. Each row in the matrix is of the form [x, y, theta]. x and y are the Cartesian coordinates of the states in the map and theta is the orientation.

  • If the input is a state validator object with SE(3) state space, the function returns the start state as a M-by-7 matrix. Each row in the matrix is of the form [x, y, z, qw, qx, qy, qz]. x, y, and z are Cartesian coordinates of the states in the map. qw, qx, qy, and qz represent the orientation in a quaternion.

Data Types: double

Goal state for motion planning, returned as a M-by-N matrix. M is the number of goal states selected for motion planning and N is the number of state variables.

  • If the input is a state validator object with SE(2) state space, the function returns the goal state as a M-by-3 matrix. Each row in the matrix is of the form [x, y, theta]. x and y are the Cartesian coordinates of the states in the map and theta is the orientation.

  • If the input is a state validator object with SE(3) state space, the function returns the goal state as a M-by-7 matrix. Each row in the matrix is of the form [x, y, z, qw, qx, qy, qz]. x, y, and z are Cartesian coordinates of the states in the map. qw, qx, qy, and qz represent the orientation in a quaternion.

Data Types: double

Extended Capabilities

C/C++ Code Generation
Generate C and C++ code using MATLAB® Coder™.

Version History

Introduced in R2024a