filterAnalysisOptions
Descripción
filterAnalysisOptions specifies analysis options for filters displayed in Filter Analyzer.
Creación
Sintaxis
Description
returns an object containing magnitude-response analysis options. Use opts = filterAnalysisOptionsopts to specify analysis options for the Filter Analyzer app.
returns filter analysis options for the specified analysis type. opts = filterAnalysisOptions(analysis)analysis sets the Analysis property.
specifies Properties using one or more name-value arguments, in addition to any combination of input arguments from previous syntaxes.opts = filterAnalysisOptions(___,Name=Value)
Input Arguments
Analysis type, specified as one of these options:
Frequency-domain analyses:
"magnitude"— Magnitude response"phase"— Phase response"groupdelay"— Group delay response"phasedelay"— Phase delay response"magestimate"— Magnitude response estimate"noisepsd"— Noise power spectral density (PSD)
Time-domain analyses:
"impulse"— Impulse response"step"— Step response
Other analyses:
"polezero"— Pole-zero plot"info"— Filter information"coefficients"— Filter coefficients
You can also specify analysis as a name-value argument: filterAnalysisOptions(Analysis=analysis) is equivalent to filterAnalysisOptions(analysis).
For more information, see Analysis.
Overlaid analysis, specified as a string.
If you set
analysisto a frequency-domain analysis, thenoverlaymust be also a frequency-domain analysis.If you set
analysisto a time-domain analysis, thenoverlaymust be also a time-domain analysis.analysisandoverlaymust be set to different values.This argument is not supported if you set
analysisto"polezero","info", or"coefficients".
You can also specify overlay as a name-value argument: filterAnalysisOptions(Analysis=analysis,OverlayAnalysis=overlay) is equivalent to filterAnalysisOptions(analysis,overlay)
Propiedades
Analysis Type
Analysis type, specified as one of these options:
Frequency-domain analyses:
"magnitude"— Magnitude response"phase"— Phase response"groupdelay"— Group delay response"phasedelay"— Phase delay response"magestimate"— Magnitude response estimate"noisepsd"— Noise power spectral density (PSD)
Time-domain analyses:
"impulse"— Impulse response"step"— Step response
Other analyses:
"polezero"— Pole-zero plot"info"— Filter information"coefficients"— Filter coefficients
For more information, see Analysis on the Filter Analyzer page.
Overlaid analysis, specified as a string scalar or character vector.
If you set
Analysisto a frequency-domain analysis, thenOverlayAnalysismust be also a frequency-domain analysis.If you set
Analysisto a time-domain analysis, thenOverlayAnalysismust be also a time-domain analysis.AnalysisandOverlayAnalysismust be set to different values.This argument is not supported if you set
Analysisto"polezero","info", or"coefficients".
For more information, see Analysis on the Filter Analyzer page.
Frequency Normalization and Sample Rate
Frequency normalization mode, specified as one of these options:
"normalized"— The app normalizes the response of each input filter with respect to its sample rate and computes responses using normalized frequencies expressed in rad/sample."unnormalized"— The app computes responses in cyclical frequencies expressed in hertz. For filters with no sample rate, the app assumes a rate of 1 Hz."auto"— The app uses the"unnormalized"mode if all filters under analysis have a specified sample rate and the"normalized"mode otherwise.
Tipos de datos: char | string
Reference sample rate selection mode, specified as one of these options:
"max"— The app uses the maximum sample rate of all the filters under analysis in a display."specify"— Specify a sample rate value using theReferenceSampleRateproperty.
This property does not apply if you set FrequencyNormalizationMode to "normalized".
Tipos de datos: char | string
Reference sample rate, specified as a positive scalar. The app uses the specified reference sample rate to normalize filter responses and to define the overall Nyquist range over which to analyze the filters. This property applies only if you set ReferenceSampleRateMode to "specify".
Ejemplo: 44.1e3
Tipos de datos: double
Frequency-Domain Analysis
Analysis frequency range, specified as one of these options:
"onesided"— The app computes responses over the range [0, π) when using normalized frequencies and over the range [0,referenceSampleRate/2) when using unnormalized frequencies."twosided"— The app computes responses over the range [0, 2π) when using normalized frequencies and over the range [0,referenceSampleRate) when using unnormalized frequencies."centered"— The app computes responses over the range [–π, π) when using normalized frequencies and over the range [–referenceSampleRate/2,referenceSampleRate/2) when using unnormalized frequencies. This option does not apply when you setFrequencyScaleto"log"."freqvector"— The app computes responses at the frequency points specified usingFrequencyVector."auto"— The app computes one-sided responses if all filters under analysis in a display have real-valued coefficients and two-sided responses if at least one filter has complex-valued coefficients.
Tipos de datos: char | string
Number of discrete Fourier transform points used to compute filter responses, specified as a positive integer. This property does not apply when you set FrequencyRange to "freqvector".
Ejemplo: 1024
Tipos de datos: double
Frequency scale for visualizing filter responses, specified as "linear" for a linear frequency scale or "log" for a logarithmic frequency scale. The "log" option does not apply if you set FrequencyRange to "centered".
Tipos de datos: char | string
Frequency vector over which to compute filters, specified as a vector of finite real values. If you set FrequencyVectorUnits to "normalized", the analyzer assumes the vector is in units of rad/sample. Otherwise, it assumes the vector in the selected units.
This property applies only when you set FrequencyRange to "freqvector". This property is not supported when you set either Analysis or OverlayAnalysis to "magestimate" or "noisepsd".
Ejemplo: [-pi/3 0 pi/6 pi/2] and [-200 0 100 300] are equivalent when the sample rate is 600 Hz.
Tipos de datos: double
Units for frequency vector values, specified as "normalized", "Hz", "kHz", "MHz", or "GHz". If you set this property to "normalized", the analyzer assumes the frequency vector is normalized in units of rad/sample. Otherwise, it assumes the vector is in the selected units.
This property applies only when you set FrequencyRange to "freqvector". This property is not supported when you set either Analysis or OverlayAnalysis to "magestimate" or "noisepsd".
Tipos de datos: char | string
Magnitude Response and Magnitude Estimate
Magnitude response mode, specified as one of these options:
"linear"— The app computes the filter response as the absolute value of the frequency response."squared"— The app computes the filter response as the magnitude squared of the frequency response."db"— The app computes the filter response as the magnitude, in decibel scale, of the frequency response."zerophase"— The app computes the filter response as the zero-phase response. This option does not apply if you set eitherAnalysisorOverlayAnalysisto"magestimate".
Tipos de datos: char | string
Number of trials to compute the frequency response estimate, specified as a positive integer. This property applies only when you set either Analysis or OverlayAnalysis to "magestimate".
Ejemplo: 24
Tipos de datos: double
Magnitude response normalization, specified as a logical 0 (false) or 1 (true). If you set this property to true, the analyzer normalizes the filter magnitude response to 1.
Tipos de datos: logical
Phase Response and Phase Delay Response
Units for the phase response or phase delay response, specified as "radians" or "degrees".
Tipos de datos: char | string
Option to use continuous phase when computing phase response, specified as a logical 0 (false) or 1 (true).
Tipos de datos: logical
Group Delay Response
Units for the group delay response, specified as "samples" or "time".
Tipos de datos: char | string
Noise PSD
Number of trials to compute the noise power spectral density, specified as a positive integer.
Ejemplo: 10
Tipos de datos: double
Time-Domain Analysis
Response length mode, specified as one of these options:
"auto"— The app uses theimpzlengthfunction to estimate the response length."specify"— You set the response length using theResponseLengthproperty.
Tipos de datos: char | string
Length of the time-domain response, specified as a positive integer. This property applies only if you set ResponseLengthMode to "specify".
Ejemplo: 128
Tipos de datos: double
Coefficients
Format for the filter coefficients, specified as "decimal", "hex", or "binary".
Tipos de datos: char | string
All Domains
Double-precision reference filter display, specified as a logical 0 (false) or 1 (true). If you set this property to true, Filter Analyzer displays the responses of quantized filters and their double-precision references.
Tipos de datos: logical
View of the polyphase decomposition of the polyphase filter, specified as a logical 0 (false) or 1 (true).
Tipos de datos: logical
Cascaded transfer function computation mode, specified as one of these options:
"complete"— The app computes the overall response of the cascaded sections."individual"— The app computes the response of each section."cumulative"— The app computes cumulative responses."specify"— You use theCTFAnalysisSectionsproperty to specify the combination of sections over which to compute responses.
Tipos de datos: char | string
Section combinations for cascaded transfer function (CTF) response computation, specified as a cell array. This property applies only when you set CTFAnalysisMode to "specify".
Ejemplo: {[1 2 3],[4 5 6]} directs the app to compute responses for a cascade of sections 1, 2, and 3 and a cascade of sections 4, 5, and 6.
Tipos de datos: cell
Ejemplos
Design a lowpass FIR filter and display its phase response in Filter Analyzer. Use 1024 NFFT points, and display the phase in degrees.
d = designfilt("lowpassfir", ... PassbandFrequency=0.45,StopbandFrequency=0.55, ... PassbandRipple=1,StopbandAttenuation=60); opts = filterAnalysisOptions("phase")
opts =
filterAnalysisOptions with properties:
Analysis: "phase"
OverlayAnalysis: "none"
FrequencyNormalizationMode: "auto"
ReferenceSampleRateMode: "max"
FrequencyRange: "auto"
NFFT: 8192
FrequencyScale: "linear"
PhaseUnits: "radians"
ContinuousPhase: 0
ReferenceFilter: 1
PolyphaseDecomposition: 0
CTFAnalysisMode: "complete"
opts.NFFT = 1024;
opts.PhaseUnits = "degrees";
filterAnalyzer(d,AnalysisOptions=opts)
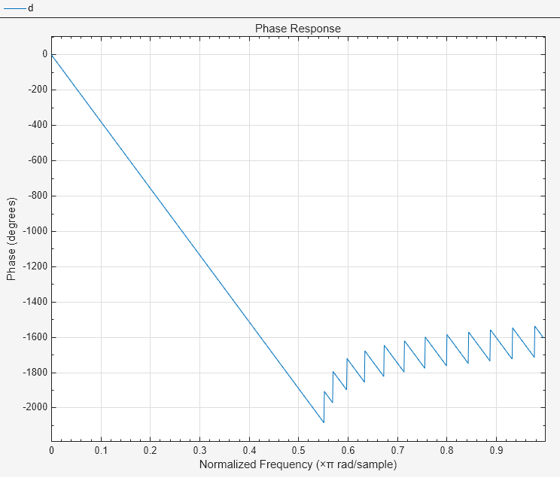
Historial de versiones
Introducido en R2024a
MATLAB Command
You clicked a link that corresponds to this MATLAB command:
Run the command by entering it in the MATLAB Command Window. Web browsers do not support MATLAB commands.
Seleccione un país/idioma
Seleccione un país/idioma para obtener contenido traducido, si está disponible, y ver eventos y ofertas de productos y servicios locales. Según su ubicación geográfica, recomendamos que seleccione: .
También puede seleccionar uno de estos países/idiomas:
Cómo obtener el mejor rendimiento
Seleccione China (en idioma chino o inglés) para obtener el mejor rendimiento. Los sitios web de otros países no están optimizados para ser accedidos desde su ubicación geográfica.
América
- América Latina (Español)
- Canada (English)
- United States (English)
Europa
- Belgium (English)
- Denmark (English)
- Deutschland (Deutsch)
- España (Español)
- Finland (English)
- France (Français)
- Ireland (English)
- Italia (Italiano)
- Luxembourg (English)
- Netherlands (English)
- Norway (English)
- Österreich (Deutsch)
- Portugal (English)
- Sweden (English)
- Switzerland
- United Kingdom (English)