showShape
Display shapes on image, video, or point cloud
Description
showShape(___,
specifies options using one or more name-value arguments in addition to the input arguments
from the previous syntax. For example, Name=Value)Color="yellow" sets the color for
the shapes to yellow.
Examples
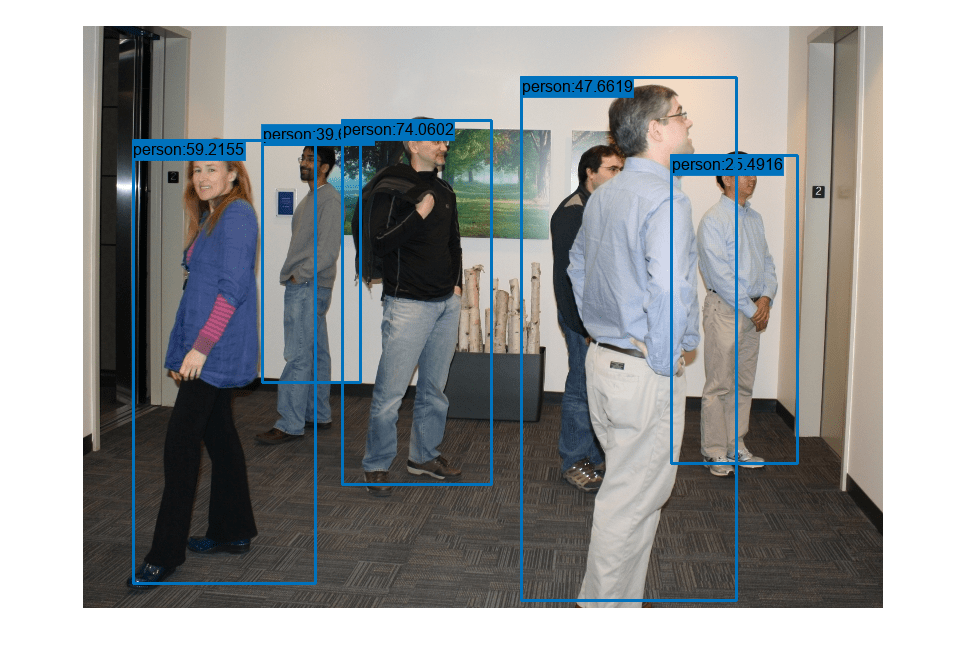
Read an image into the workspace.
I = imread("visionteam1.jpg");Create an aggregate channel features (ACF) people detector.
detector = peopleDetectorACF
detector =
  acfObjectDetector with properties:

             ModelName: 'inria-100x41'
    ObjectTrainingSize: [100 41]
       NumWeakLearners: 2048
Detect people in the image.
[bboxes,scores] = detect(detector,I);
Display the image with a labeled rectangle around each detected person. Display the associated detection score around each detected person.
figure
imshow(I)
labels = "person:" + scores;
showShape("rectangle",bboxes,Label=labels)
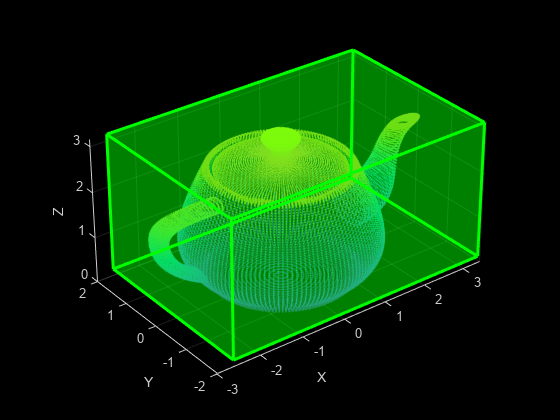
Read point cloud data into the workspace.
ptCloud = pcread("teapot.ply");Display the point cloud data.
figure
pcshow(ptCloud)
xlabel("X")
ylabel("Y")
zlabel("Z")
Define a cuboid and display it in green with an opacity of 0.5.
pos = [0.3753 0 1.65 6 4 3 0 0 0];
showShape("cuboid",pos,Color="green",Opacity=0.5)
Read point cloud data into the workspace.
ptCloud = pcread("teapot.ply");Define a rotation matrix and 3-D transform to rotate the point cloud, and an associated cuboid, by 5 degrees.
rot = 5;
R = [ cosd(rot) sind(rot) 0 0; ...
     -sind(rot) cosd(rot) 0 0; ...
      0       0           1 0; ...
      0       0           0 1];

tform = affine3d(R);
Compute the x and y rendered limits of the point cloud, to ensure that you do not clip the point cloud during rotation.
pcLimits = abs([ptCloud.XLimits ptCloud.YLimits]);
maxLimit = max(pcLimits);
Add a margin to the plot to prevent the rotation from clipping the cuboid.
margin = 1;
maxLimit = maxLimit + margin;

xlimits = [-maxLimit maxLimit];
ylimits = [-maxLimit maxLimit];
zlimits = ptCloud.ZLimits;
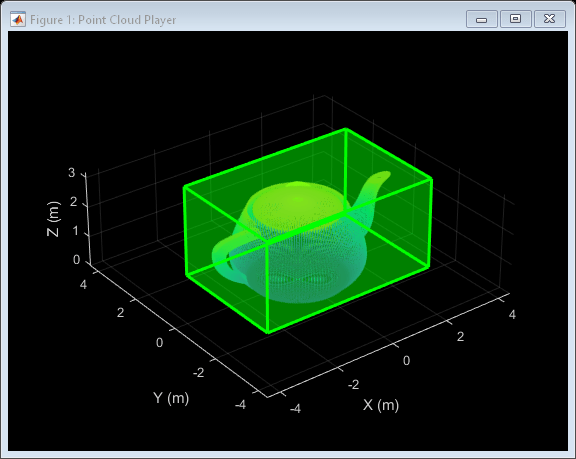
Create a player for visualizing the point cloud.
player = pcplayer(xlimits,ylimits,zlimits);
Customize the player axes labels.
xlabel(player.Axes,"X (m)");
ylabel(player.Axes,"Y (m)");
zlabel(player.Axes,"Z (m)");
Define a cuboid around the point cloud.
cuboidPosition = [0.3753 0 1.65 6 4 3 0 0 0];
Define the output view for a cuboid rotation. Use the same limits as the player so that the view does not clip the cuboid. Then, display the rotated point cloud and cuboid.
gridSize = [1 1 1];
ref = imref3d(gridSize,xlimits,ylimits,zlimits);

for i = 1:round((360/rot))
    % Rotate the point cloud.
    ptCloud = pctransform(ptCloud,tform);

    % Rotate the cuboid.
    cuboidPosition = bboxwarp(cuboidPosition,tform,ref);

    % Show the rotated point cloud data.
    view(player,ptCloud)

    % Show the rotated cuboid.
    showShape("cuboid",cuboidPosition, ...
        Parent=player.Axes, ...
        Color="green", ...
        Opacity=0.5)

    % Use drawnow to synchronize the point cloud and shape visualizations.
    drawnow
end
Input Arguments
Type of shape, specified as "rectangle",
"line", "polygon", "circle",
"cuboid", "projected-cuboid", or
"ellipse".
Data Types: char
Position of shape, specified according to the type of shape, as described in the table.
| Shape | Position | Definition |
|---|---|---|
rectangle | For one or more axis-aligned rectangles, specify as an M-by-4 numeric matrix, where each row specifies a rectangle of the form .
| |
|
For one or more rotated rectangles, specify in spatial coordinates as an M-by-5 numeric matrix, where each row specifies a rotated rectangle of the form [xctr yctr w h yaw].
| 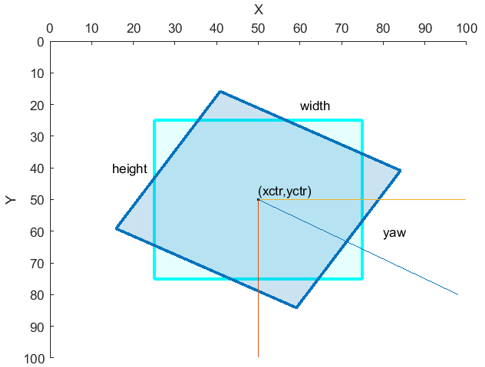 | |
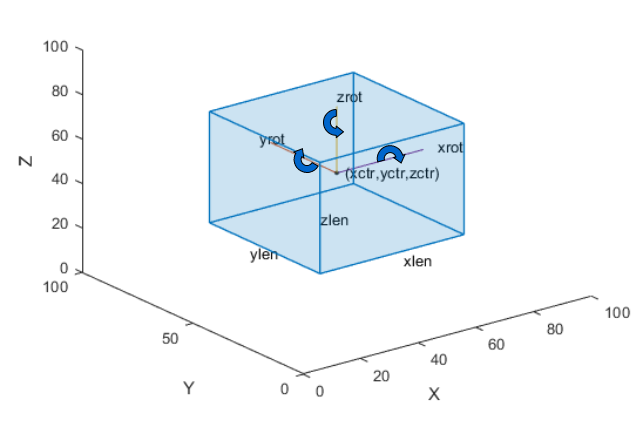
cuboid | For one or more cuboids, specify in spatial coordinates as an M-by-9 numeric matrix where each row specifies a cuboid of the form [xctr yctr zctr xlen ylen zlen xrot yrot zrot], where
|
|
circle | For one or more circles, specify spatial coordinates as an M-by-3 numeric matrix, where each row specifies a circle of the form [xctr yctr radius].
| |
ellipse | For one or more ellipses, specify in spatial coordinates as an M-by-5 matrix, where each row specifies an ellipse of the form [xctr yctr major minor yaw]
|
|
| For one or more lines, specify spatial coordinates using one of these formats to specify a single line with connected endpoints, multiple lines with the same number of endpoints, or multiple lines with different numbers of endpoints.
| |
polygon | For one or more polygons, specify in spatial coordinates as an M-by-1 cell array, where each cell contains an L-by-2 matrix of [x y] vertex locations or a 1-by-2L vector of consecutive vertex locations of the form [x1, y1, x2,y2, … xL,yL ].
|
|
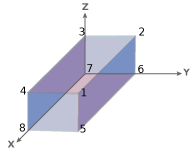
projected-cuboid | For one or more projected cuboids, specify in spatial coordinates as an 8-by-2-by-M array or an M-by-8 matrix, where M is the number of projected cuboids. When specified as an 8-by-2-by-M array, each row must contain the [x y] location of a projected cuboid vertex. The vertices connect to form a cuboid with six faces. The order of the input vertices must match the order shown in the diagram. When specified as an M-by-8 matrix, each row specifies the dimensions of the front-facing and rear-facing sides of a projected cuboid in the form, [x1 y1 w1 h1 x2 y2 w2 h2], where [x1 y1] and [x2 y2] specify the upper-left coordinates of the front-facing and rear-facing sides, respectively, and [w1 h1] and [w2 h2] specify the corresponding widths and heights. |
|
Name-Value Arguments
Specify optional pairs of arguments as
Name1=Value1,...,NameN=ValueN, where Name is
the argument name and Value is the corresponding value.
Name-value arguments must appear after other arguments, but the order of the
pairs does not matter.
Example: showShape("rectangle",bboxes,Color="yellow") sets the color
for the shapes to yellow.
Before R2021a, use commas to separate each name and value, and enclose
Name in quotes.
Example: showShape("rectangle",bboxes,"Color","yellow") sets the
color for the shapes to yellow.
Shape label, specified as a scalar, M-element vector, or an M-element cell array of character vectors, where M is the number of shapes.
If the input is a scalar value, then the function applies the label to each shape. If the input is an M-element vector or cell array, then the function applies the unique label to the corresponding shape, using the order in which you specify the shapes to the function.
Shape color, specified as a short color name, color name, vector of color names, three-column matrix of RGB triplets.
The supported colors table lists RGB intensities in the range [0, 1], but you must
specify RGB triplets in the range of your selected data type. For example, if
specifying this argument as a matrix of uint8 values, you must
convert each intensity value to the range [0, 255]. To convert the listed intensity
values to a uint8 data type, use the code
uint8(255*intensity), where intensity is an RGB triplet value
listed in the table.
You can specify a different color for each shape or one color for all shapes. To
specify one color for all markers, specify Color as a color name
or an [R
G
B] vector.
| Specification | Format | Example |
|---|---|---|
| Specify one color for all shapes (or markers) | Short color name or color name |
|
RGB triplet |
| |
| Specify a color for each shape (or marker) | Vector of color names |
|
Three-column matrix of RGB triplets | [1 0 0 0 1 1 1 0 1 1 1 1]  |

This table lists the supported shape colors.
| Color Name | Short Name | RGB Triplet | Appearance |
|---|---|---|---|
"red" | "r" | [1 0 0] |
|
"green" | "g" | [0 1 0] |
|
"blue" | "b" | [0 0 1] |
|
"cyan" | "c" | [0 1 1] |
|
"magenta" | "m" | [1 0 1] |
|
"yellow" | "y" | [1 1 0] |
|
"black" | "k" | [0 0 0] |
|
"white" | "w" | [1 1 1] |
|
Data Types: logical | uint8 | uint16 | int16 | double | single | cell
Opacity of the shape fill, specified as a scalar or M-element
vector of numeric values in the range [0 1], where M is the number
of shapes. To use the same opacity for all shapes, specify a scalar opacity value. For
a fully opaque shape fill, specify Opacity as
1.
Output axes, specified as an Axes graphics object. For more
information on Axes object properties, see Axes Properties.
Shape border line color, specified as a short color name, color name, vector of color names, three-column matrix of RGB triplets.
The supported colors table lists RGB intensities in the range [0, 1], but you must
specify RGB triplets in the range of your selected data type. For example, if
specifying this argument as a matrix of uint8 values, you must
convert each intensity value to the range [0, 255]. To convert the listed intensity
values to a uint8 data type, use the code
uint8(255*intensity), where intensity is an RGB triplet value
listed in the table.
You can specify a different color for each shape or one color for all shapes. To
specify one color for all markers, specify LineColor as a color
name or an [R
G
B] vector.
Striped line color, specified as a short color name, color name, vector of color
names, three-column matrix of RGB triplets. The striped line color alternates between
the colors specified by LineColor and
LineStripeColor.
The supported colors table lists RGB intensities in the range [0, 1], but you must
specify RGB triplets in the range of your selected data type. For example, if
specifying this argument as a matrix of uint8 values, you must
convert each intensity value to the range [0, 255]. To convert the listed intensity
values to a uint8 data type, use the code
uint8(255*intensity), where intensity is an RGB triplet value
listed in the table.
You can specify a different color for each striped line or one color for all
lines. To specify one color for all the lines, specify
LineStripeColor as a color name or an [R
G
B] vector.
Border line width in pixels, specified as a positive integer or an M-element vector of positive integers, where M is the number of shapes. To use the same line width for all shapes, specify a scalar positive integer. Otherwise, specify an M-element vector of positive integers.
Border line opacity of shape, specified as a scalar or
M-element vector of numeric values in the range [0 1], where
M is the number of shapes. To use the same opacity for all
shapes, specify a scalar opacity value. For a fully opaque shape fill, specify
Opacity as 1.
Label text color, specified as a short color name, color name, vector of color names, three-column matrix of RGB triplets.
The supported colors table lists RGB intensities in the range [0, 1], but you must
specify RGB triplets in the range of your selected data type. For example, if
specifying this argument as a matrix of uint8 values, you must
convert each intensity value to the range [0, 255]. To convert the listed intensity
values to a uint8 data type, use the code
uint8(255*intensity), where intensity is an RGB triplet value
listed in the table.
You can specify a different color for each label or one color for all labels. To
specify one color for all markers, specify LabelTextColor as a
color name or an [R
G
B] vector.
Label opacity of shape, specified as a scalar or M-element
vector of numeric values in the range [0 1], where M is the number
of shapes. To use the same opacity for all labels, specify a scalar opacity value. For
a fully opaque shape fill, specify Opacity as
1.
Label font, specified as "FixedWidth" or a font that your
system supports. To display and print text properly, you must select a font that your
system supports. If you select an unsupported font, the function returns an error. If
you specify "FixedWidth", the function uses the font specified by
the FixedWidthFont property of the Root Properties object. The fixed-width font relies on the value of
get(0,"FixedWidthFontName").
Label font size in points, specified as a positive scalar.
Original orientation indicator, specified as a numeric or logical
1 (true) or 0
(false). A value of 1
(true) displays the original orientation of the rotated rectangle
by using an arrow annotation on the bounding box. The original orientation is defined
as a zero rotation angle. A value of 0 (false)
does not show the arrow annotation.
This argument applies only when Shape describes a rotated
rectangle or an ellipse.
Data Types: logical | integer