metricsByArea
R2026bSyntax
Description
areaMetrics = metricsByArea(metrics,objectAreaRanges)objectAreaRanges. The function evaluates
the specified bounding box size range within the existing object detection
metrics.
areaMetrics = metricsByArea(metrics,objectAreaRanges,ClassNames)
Examples
Load a table containing images and ground truth bounding box labels. The first column contains the images, and the remaining columns contain the labeled bounding boxes.
data = load("vehicleTrainingData.mat");
trainingData = data.vehicleTrainingData;
Set the value of the dataDir variable as the location where the vehicleTrainingData.mat file is located. Load the test data into a local vehicle data folder.
dataDir = fullfile(toolboxdir("vision"),"visiondata");
trainingData.imageFilename = fullfile(dataDir,trainingData.imageFilename);
Create an imageDatastore using the files from the table.
imds = imageDatastore(trainingData.imageFilename);
Create a boxLabelDatastore using the label columns from the table.
blds = boxLabelDatastore(trainingData(:,2:end));
Load a pretrained YOLO v2 object detector trained to detect vehicles into the workspace.
vehicleDetector = load("yolov2VehicleDetector.mat");
detector = vehicleDetector.detector;
Compute Object Detection Performance Metrics
Run the detector on the test images. Set the detection threshold to a low value to detect as many objects as possible. This helps you evaluate the detector precision across the full range of recall values.
results = detect(detector,imds,Threshold=0.01);
Compute metrics for evaluating the performance of an object detector using the evaluateObjectDetection function.
metrics = evaluateObjectDetection(results,blds);
Evaluate Metrics Across Object Size Ranges
Extract the anchor boxes from the detector, calculate their areas, and sort the areas.
areas = prod(detector.AnchorBoxes,2);
sortedAreas = sort(areas);
Define area range limits using the calculated areas. The upper limit for the last range is set to three times the size of the largest area, which is sufficient for the objects in this data set.
lowerLimit = sortedAreas;
upperLimit = [sortedAreas(2:end);3*sortedAreas(end)];
areaRanges = [lowerLimit upperLimit]
areaRanges = 4×2

          64         960
         960        1536
        1536        3456
        3456       10368
Evaluate detector performance across vehicle size ranges using the metricsByArea object function. Specify the object size ranges using the bounding box area ranges. The number of vehicles falling into each area range is computed in the NumObjects column.
areaMetrics = metricsByArea(metrics,areaRanges,ClassName="vehicle");
disp(areaMetrics(:,1:3))
AreaRange NumObjects APOverlapAvg
_____________ __________ ____________
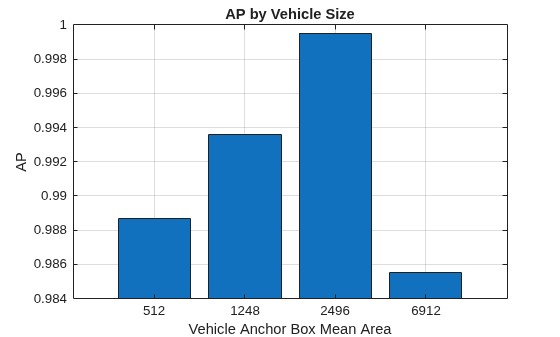
64 960 119 0.9887
960 1536 12 0.99359
1536 3456 45 0.99952
3456 10368 141 0.98551
Plot the average precision (AP) metric, averaged across all overlap thresholds, as a function of the mean object size per vehicle size range.
figure
bar(categorical(mean(areaRanges,2)),areaMetrics.APOverlapAvg)
title("AP by Vehicle Size")
xlabel("Vehicle Anchor Box Mean Area")
ylabel("AP")
ylim([0.984 1])
grid on
Input Arguments
Output Arguments
Version History
Introduced in R2023b

