How to Register and Align Features in a Video with MATLAB
From the series: “How To” Video Series for Biomedical and Pharmaceutical Applications
Computer Vision Toolbox™ is used to perform image registration to stabilize a video captured during a surgical procedure using an endoscopic near-infrared fluorescence imaging system. To do so, tracked points are used to compute a transformation to warp the current frame such that features remain aligned with the initial frame. With each video frame aligned to the same reference frame, the mean intensity of a grid of regions can then be quickly computed using distinct block processing of the warped intensity frame. In this way, computer vision is helping surgeons automate data collection to research if changes in the fluorescence intensity time histories can be used to discriminate normal tissue from cancerous tissue.
Published: 19 Jun 2023
Hello, everyone, Paul here from MathWorks. Today, I'm going to show you how you can use computer vision to automatically register and align features in a video. We'll once again be working with a video captured during a surgical procedure using an endoscopic near-infrared fluorescence imaging system.
You may recall from my previous how-to video that this system simultaneously captures and displays videos in both the visible white light and near-infrared spectrums. When used with an injection of indocyanine green fluorescent dye into the bloodstream, this system offers an effective way for clinicians to visualize blood perfusion, as the dye becomes fluorescent when excited by near-infrared light. A team at the University College Dublin Center for Precision Surgery is researching if changes in the fluorescence intensity that result from variations in the dye absorption can be used to discriminate normal tissue from cancerous tissue.
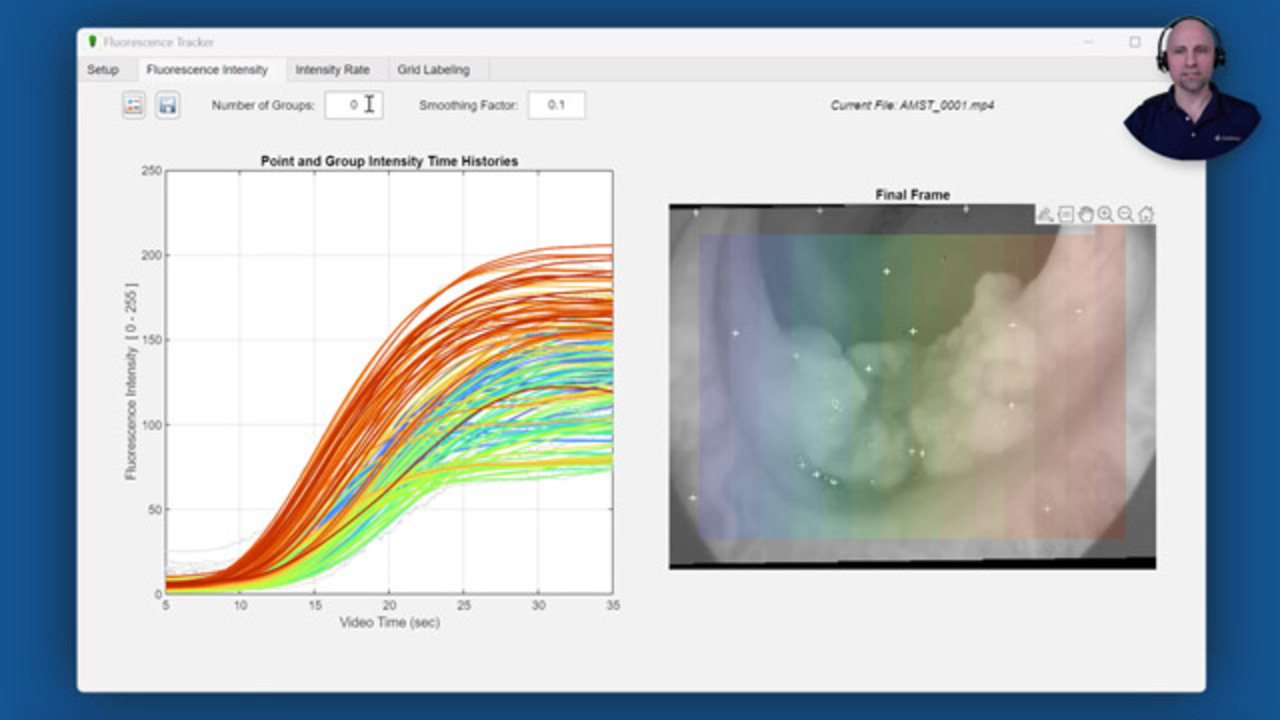
The Fluorescent Tracker App you see here has been updated to provide an alternative approach to automate data collection for their analysis. Once again, feature points are automatically detected and tracked between video frames. However, instead of specifying regions of interest, these control points are spread across the entire video frame and used to compute the transform between the current-point locations and the initial-point locations. This transformation is then used to perform image registration, which warps the current frame to keep features aligned with the initial frame.
The benefit of this approach is that with each video frame now aligned to the same reference frame, the mean intensity of each of the displayed grid regions can be quickly computed using distinct block processing of the warped intensity frame. These intensity time histories are then plotted and color coded to match their corresponding grid region. Let's take a closer look at the steps and code used to implement this alternative approach.
After creating a video reader for the desired file, we'll set the initial tracking time to occur just before the dye begins to enter the bloodstream and then read the current video frame at this time. Notice that since the dye has not yet begun absorption, the intensity image is mostly black. Since there are no features for us to track in this image, we'll once again detect and track points in the white-light color image. To improve performance, we'll limit the number of points such that they are uniformly distributed across the video frame. With the initial control point selected, we'll create and initialize a point tracker vision system object.
Next, we'll define the grid of regions over which we'll be computing the mean intensity values. Each grid region is defined by specifying the xy coordinates of its upper-left corner along with its width and height in pixels. Since the initial frame does not require image registration, with the grid size defined, we can now use distinct block processing to compute the corresponding mean intensity value for each grid region. We can examine the resulting matrix by displaying the block-processed image with scaled colors. Notice that, as expected, the matrix elements with the largest values correspond to the grid regions containing the brightest intensities.
We're now ready to loop through the remaining video frames. During each loop, we'll perform four steps. First, for each point in the previous frame, the point tracker attempts to find the corresponding point in the current frame, even as the camera slightly moves around. Second, these track points are used to compute the geometric transformation between their current locations and their initial locations.
Third, this transformation is used to warp the current intensity frame to align its features with those in the initial frame. And fourth, we'll once again use block processing to compute the mean intensity value for each grid region. However, this time, we'll take care to ignore any regions impacted by the black padding that may result from image warping. Finally, we'll display the resulting fluorescence intensity time histories for each grid region. For visualization purposes, we'll sort the intensities by their final value and color code the grid regions to match the signal colors.
This functionality has been added to the Fluorescence Tracker App we saw earlier. The Fluorescence Tracker App is available for download via the MathWorks File Exchange or GitHub. If you'd like to learn more about image registration and other computer vision techniques, please check out our free Computer Vision Onramp at matlabacademy.mathworks.com. This free, interactive tutorial will teach you the basics of a typical computer vision workflow in MATLAB in about two hours. Thanks for watching.


Seleccione un país/idioma
Seleccione un país/idioma para obtener contenido traducido, si está disponible, y ver eventos y ofertas de productos y servicios locales. Según su ubicación geográfica, recomendamos que seleccione: United States.
También puede seleccionar uno de estos países/idiomas:
América
- América Latina (Español)
- Canada (English)
- United States (English)
Europa
- Belgium (English)
- Denmark (English)
- Deutschland (Deutsch)
- España (Español)
- Finland (English)
- France (Français)
- Ireland (English)
- Italia (Italiano)
- Luxembourg (English)
- Netherlands (English)
- Norway (English)
- Österreich (Deutsch)
- Portugal (English)
- Sweden (English)
- Switzerland
- United Kingdom (English)