Generating Simulation Scenarios by Sampling Model Quantities | SimBiology Tutorials for QSP, PBPK, and PK/PD Modeling and Analysis - MATLAB
Video Player is loading.
Current Time 0:00
Duration 7:34
Loaded: 2.18%
Stream Type LIVE
Remaining Time 7:34
 
1x
  • Chapters
  • descriptions off, selected
  • en (Main), selected
    Video length is 7:34

    Generating Simulation Scenarios by Sampling Model Quantities | SimBiology Tutorials for QSP, PBPK, and PK/PD Modeling and Analysis

    From the series: SimBiology Tutorials for QSP, PBPK, and PK/PD Modeling and Analysis

    Learn how to quickly evaluate variability by sampling model parameters or testing dosing schedules. In this video, you will learn how to generate samples for parameters or dosing schedules using the Model Analyzer app, or by using scripts.

    Published: 24 Dec 2019

    Evaluating responses to biological variability and explaining dosing schedule are common tasks in pharmacology. And to perform this task, you will need to sample model quantities, such as parameters, initial concentrations, compartment volumes, or dosing parameters. In this short video, I will show you how to sample model quantities in SimBiology.

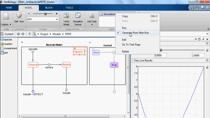
    And for this, we will use the example of a target mediated drug disposition model. The goal here is to evaluate two dosing schedules on a virtual population generated by sampling model quantities from a distribution. We will create a virtual population by sampling the drug elimination rate and the volume of the plasma compartment. The tools will be given to the species drug. And we will plot the resulting dynamics of the receptor occupancy.

    To perform this task, I will create a new program to generate samples. I will apply a Bayesian variant of estimated values and log only the Receptor Occupancy, RO. Now, I come to a section where I can define the sample to generate. In this section, there is the concept of parameter set.

    So the first parameter set we will create will define the virtual population. I can choose to sample my other quantities, dosing objects or variants. For the virtual population, I'll choose quantity and call it Vpop.

    Now, I could list the values to simulate. I could sample them from a distribution or extract them from a data set in my project. Here, I'll choose values from a distribution and generate 20 samples. I can now list the parameters to sample. The first one will be the drug elimination rate, kel.

    It will be normally distributed. But there's a long list of distributions to choose from. The mean of the distribution is the current model value or the value in the baseline variant. Sigma, the standard deviation, will be set to 0.2.

    I can now choose the volume of the plasma compartment. In SimBiology, this is always denoted by the name of the compartment. So this is here Plasma. It will also be normally distributed, with a mean of 4.9 and a strong deviation of 1.

    There is a long list of methods to choose from for the sampling method. But here, I'll stick to the random sampling with the covariance matrix. So now, we have defined a virtual population. We can create a new parameter set to list the dosing schedules to simulate.

    So I'll choose here dose, call it Dose. I could choose doses from my model or extract the dosing information from a data set in my project. So here, I choose doses in the model.

    I choose a single dose daily, and two doses daily. Now, I've created two parameter sets-- one for the dosing schedules, one for the virtual population. So the question is now how to combine them.

    So here at the top of this section, you see the different options. By default, since we have two parameter sets with two different numbers of samples, we get the Cartesian product, which is exactly what we want for each patient individual population. We want to test both dosing schedules. So 2 times 20 is equal to 40 samples.

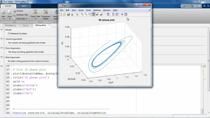
    If I had the same number of samples in both data sets, I could also choose element-wise. So now, we're ready to generate our samples by clicking on running this step. For the 40 samples were generated, and are now plotted in a plot matrix. I can now go back to my program and head to step 2-- simulate.

    So here, I don't necessarily need to regenerate the samples. They were generated previously. I can only click on run this step to run the 40 simulations.

    So now, we ran the 40 simulations. I can now slice the data to visualize it. So we could, for instance, choose a grid with the dosing schedules and probably remove the color coding. Now if you want to automate this task, you can choose to view the program code to get the MATLAB code that corresponds to what we've done interactively. So here, View Program Code.

    We generate a MATLAB function that you can save and use in a script. This function has the same exact structure as the program itself. It will first do the setup of the program-- what to log, for instance. It will generate the samples, and then run the simulations. In the local function to generate the samples, you'll see that it's going to use the new concept called SimBiology.scenarios that is used in the background to generate those samples.

    So this code is runable. You can take it, save it, and run it. And if you want to have more information about SimBiology.scenarios, you can simply go to the app and have a look at how to define those scenarios. Let's summarize what the SimBiology.scenarios have to offer.

    It supports enumeration entries where you can list the values to simulate. And it supports also sampling entries. Enumeration entries support any model quantities, any doting objects or variants, while the sampling entries support doting parameters and model quantities. If all quantities are normally distributed, you can choose to define a covariance matrix or rank correlation matrix.

    If they're not normally distributed, you can define a rank correlation matrix. If you choose to define a covariance matrix, you can use the random sampling methods or the Latin hypercube sampling method. If you choose the rank correlation matrix, you have access to all five sampling methods, including Copulas, Sobol sequence, and Halton sequence.

    In terms of combination, you have the choice between a Cartesian product and element-wise product. To illustrate this, let's take a short example with three doses object and three variants. If you choose a Cartesian product, we will get a total of nine scenarios with all possible combinations between the doses and the variants. If we choose the element-wise product, we will get a total of three scenarios.

    So those combinations can be used also for sub-entries to generate any kind of scenarios you will need. So you can now go to the recommendation and start with the example and generate your samples.

    Related Products