Contenido principal

La traducción de esta página aún no se ha actualizado a la versión más reciente. Haga clic aquí para ver la última versión en inglés.

addDisplays

Add new analysis displays to Filter Analyzer app

Desde R2024a

Descripción

dispnum = addDisplays(fa) adds a new magnitude response analysis display to the Filter Analyzer app fa and returns the identification number corresponding to the new display.

dispnum = addDisplays(fa,addnum) adds addnum new magnitude response analysis displays to fa and returns their identification numbers.

addDisplays(___,AnalysisOptions=opts) sets the analysis options of the new displays to the values specified in opts. Use filterAnalysisOptions to create opts.

addDisplays(___,Name=Value) sets the analysis options of the new displays using name-value arguments. For a list of available options, see filterAnalysisOptions. Options specified this way apply to all new displays. You cannot use this syntax and the previous one simultaneously.

addDisplays(___,FilterNames=filtnames) adds new displays and plots the filters with names specified in filtnames.

ejemplo

Ejemplos

contraer todo

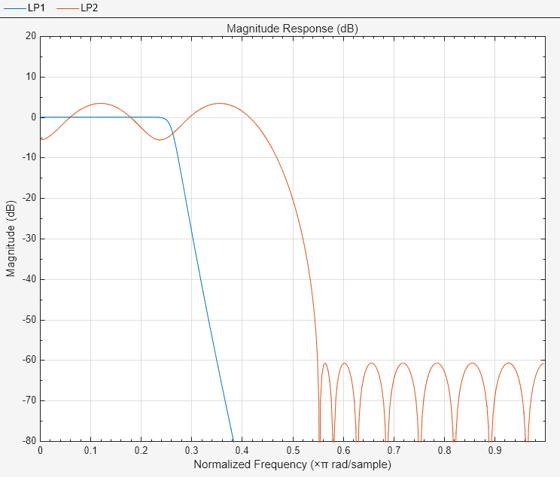
Start the Filter Analyzer app with two filters.

d1 = designfilt("lowpassiir", ...
    PassbandFrequency=0.25,StopbandFrequency=0.35);
d2 = designfilt("lowpassfir", ...
    PassbandFrequency=0.45,StopbandFrequency=0.55,PassbandRipple=10);

fa = filterAnalyzer(d1,d2,FilterNames=["LP1" "LP2"]);
zoom(fa,"y",[-80 20])

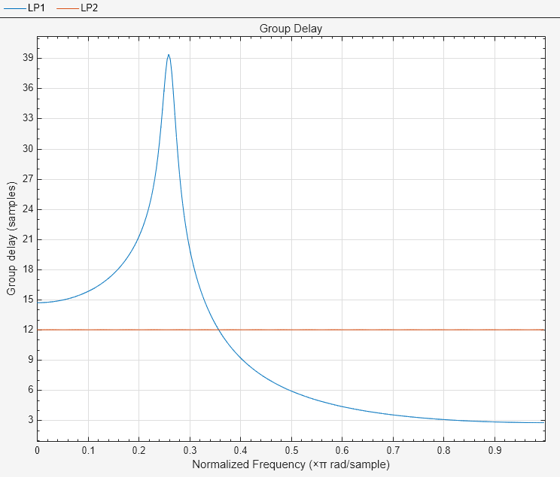
Add a group delay display. Plot the filters in the new display.

addDisplays(fa,Analysis="groupdelay",FilterNames=["LP1" "LP2"])

%addFilters(fa,d1,d2)

For best results, run this example directly in MATLAB®.

Argumentos de entrada

contraer todo

Filter Analyzer app handle, specified as a filterAnalyzer object.

Number of displays to add, specified as an integer.

Tipos de datos: single | double | int8 | int16 | int32 | int64 | uint8 | uint16 | uint32 | uint64

Analysis options, specified as a filterAnalysisOptions object. If you add more than one display:

  • To specify option values that apply to all the new displays, specify opts as a filterAnalysisOptions object.

  • To specify different option values for each display, specify opts as a cell array of filterAnalysisOptions objects with addnum elements.

Ejemplo: filterAnalysisOptions("phase") specifies that the new display show filter phase responses.

Ejemplo: filterAnalysisOptions("magnitude",NFFT=2048,FrequencyRange="twosided") specifies that the new display plot magnitude responses spanning the whole unit circle and using 2048 discrete Fourier transform points.

Filter names, specified as a vector of strings or cell of character vectors. Filter names are the names that identify the different filters in the Filters table of the Filter Analyzer app.

Ejemplo: ["LP_a" "LP_b"]

Tipos de datos: cell | string

Output Arguments

contraer todo

Display identification number, returned as an integer or vector of integers. If addDisplays adds more than one display, dispnum is a vector. Use display identification numbers to target displays when using other Filter Analyzer functions. Identification numbers appear above the plotting area of the app, on the tabs that correspond to the different displays.

Historial de versiones

Introducido en R2024a