setAnalysisOptions
Sintaxis
Descripción
setAnalysisOptions( sets the analysis options for the active display in the Filter Analyzer app fa,opts)fa to the options specified in opts.
setAnalysisOptions( sets display analysis options using name-value arguments. For a list of available options, see the properties of the fa,Name=Value)filterAnalysisOptions object. Options specified this way apply to all the displays that you specify. If you want to specify different options for different displays, use filterAnalysisOptions objects.
You cannot mix this syntax with the previous syntax. In other words, you cannot specify options using name-value arguments and filterAnalysisOptions objects simultaneously.
setAnalysisOptions(___,DisplayNums= sets the analysis options for the displays specified in dispnums)dispnums.
Ejemplos
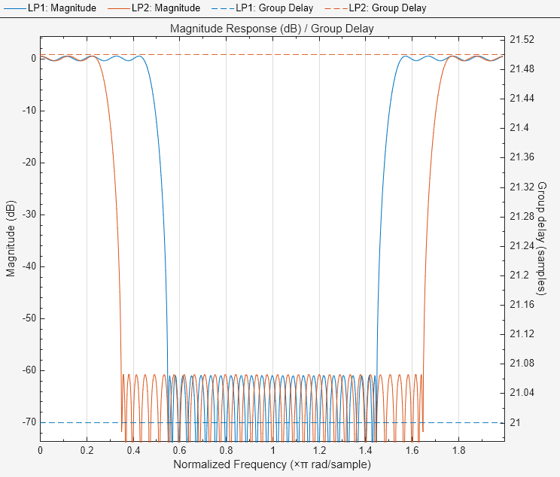
Design two lowpass filters and display them in Filter Analyzer.
d1 = designfilt("lowpassfir", ...
    PassbandFrequency=0.45,StopbandFrequency=0.55);
d2 = designfilt("lowpassfir", ...
    PassbandFrequency=0.25,StopbandFrequency=0.35);
fa = filterAnalyzer(d1,d2,FilterNames=["LP1" "LP2"]);
Set the analysis options by adding the group delay response as an overlaid analysis and display responses over a two-sided frequency range using 1024 FFT points.
opts = filterAnalysisOptions("magnitude","groupdelay");
opts.FrequencyRange = "twosided";
opts.NFFT = 1024;
setAnalysisOptions(fa,opts)
Argumentos de entrada
Historial de versiones
Introducido en R2024a