Discrete-Event Chart Precise Timing
This example shows the precise timing that a Discrete-Event Chart block executes as it generates parts in a facility. The behavior of the Discrete-Event Chart and the Stateflow® blocks are compared. Both blocks require a Stateflow® license. Using a Discrete-Event Chart block, the example shows that the temporal resolution of events can be arbitrarily precise and independent from the model sample time.
In this example, an entity represents a part generated in pi seconds. The solver is set to Fixed-step with step size 1, and for the Stateflow® Chart block, the Enable Super Step Semantics check box is selected. For more information, see Super Step Semantics (Stateflow).
Model Description

In this model, the Part Generation block is created using a Discrete-Event Chart block and the Part Generation Chart is created using a Stateflow® Chart block. Both blocks contain the same state transition model, including two states, CreatePart and WaitForQA.
The
CreatePartstate represents the production of aPartinpiseconds.
The
WaitForQAstate represents the wait for the quality control department forPart's validation.

Enable the sample time annotation and simulate the model. Observe that the sample time for the Discrete-Event Chart block reflects the event-based sampling.

Simulation Results
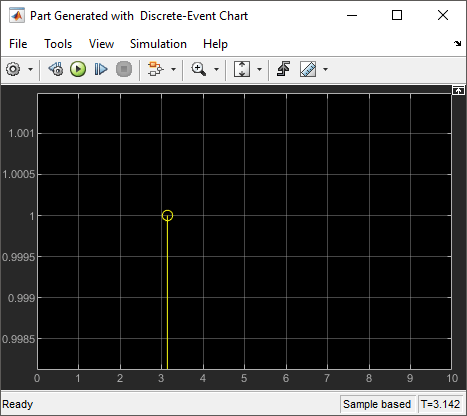
Observe that Part is generated by the Discrete-Event chart after precisely 3.14 seconds, independent from the simulation step size.
Observe that Part is generated by the Stateflow® Chart after 4 seconds. This is due to the fixed step size 1 , which causes the Stateflow® Chart block to wait until the next simulation step.
