caliper
Description
measurementData = caliper(I,linePosition)I, using a caliper
        tool by positioning a profile scan line at the position
        linePosition.
Note
This functionality requires the Automated Visual Inspection Library for Computer Vision Toolbox™. You can install the Automated Visual Inspection Library for Computer Vision Toolbox from Add-On Explorer. For more information about installing add-ons, see Get and Manage Add-Ons.
measurementData = caliper(I,linePosition,Name=Value)Width=10 specifies the width of the profile scan as 10 pixels.
Examples
Load an image into the workspace.
I = imread("coins.png");Display the image using the imageshow function.
imageshow(I)

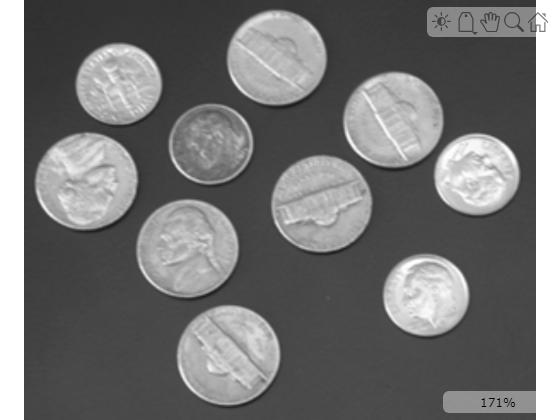
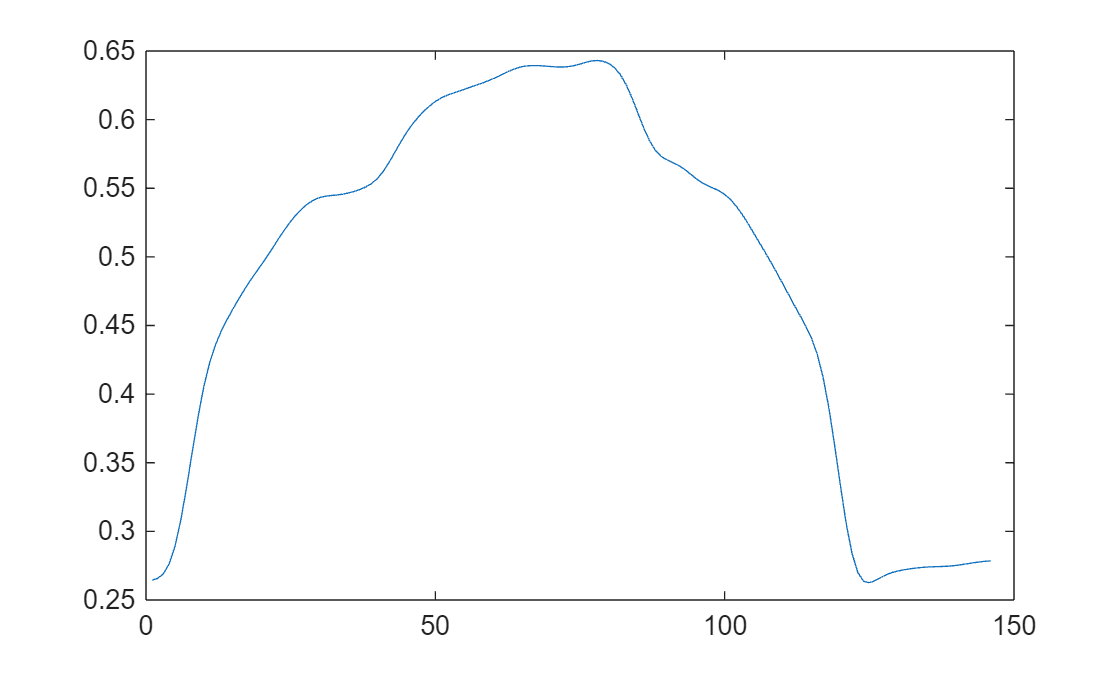
Measure the distance between the edges of the darkest nickel coin using the caliper function. Specify the start and end point of the profile scan line as [171 89; 218 131]. To detect the coin edges, specify a gradient threshold lower than the maximum intensity gradient across the scan length using the GradientThreshold name-value argument. Since the coin contains two edge pairs, the function returns the distance between them, or the coin width, as IntraEdgeDistance value.
measureOut = caliper(I,[158 89; 218 131],GradientThreshold=0.04)
measureOut = struct with fields:
    InterEdgeDistance: [1×0 double]
    IntraEdgeDistance: 56.4544
        GradientValue: [0.0520 -0.0579]
             Distance: [3.4186 59.8729]
          ProfileData: [146×1 double]
Display the intensity gradient value along the profile scan line.
figure plot(measureOut.ProfileData)

Input Arguments
Input image for which to perform caliper measurement, specified as one of these values:
| Image Type | Data Format | 
|---|---|
| Grayscale | H-by-W numeric matrix | 
| RGB | H-by-W-by-3 numeric array | 
Profile line position, in pixels, specified as a 2-by-2 numeric matrix of the form [x1 y1; x2 y2], where the [x1 , y1] and [x2 ,y2] are coordinates of the start point and end point of the line, respectively.
Name-Value Arguments
Specify optional pairs of arguments as
      Name1=Value1,...,NameN=ValueN, where Name is
      the argument name and Value is the corresponding value.
      Name-value arguments must appear after other arguments, but the order of the
      pairs does not matter.
    
Example: caliper(I,linePosition,Width=10) specifies the width of the
        profile scan as 10 pixels.
Profile scan width, specified as a positive scalar. The width is the area within
              which the caliper function computes profile scan lines
              measurements. The function scans in lines orthogonal to the profile centerline and
              using these measurements, computes a mean 1-D profile for gradient detection.
Edge transition type used in edge detection, specified as one of these options:
- "rising"— Detect darker-to-brighter edge transitions.
- "falling"— Detect brighter-to-darker edge transitions.
- "both"— Detect both brighter-to-darker and darker-to brighter-edge transitions.
The edge transition is relative to the direction of the scan line, from start point to end point.
Gradient threshold for a gradient to be considered an edge, specified as a
              positive scalar in range [0, 1]. The gradient at each scan point is
              the normalized average gradient across the profile line width, Widthcaliper function evaluates
              this value at each point along the scan line. Increase the gradient threshold value to
              detect fewer false positive edges.
Measurement mode used to compute edge data, specified as
                "edge-pair" or "single-edge". This argument
              determines the edge type to detect, and how the measurementData
              argument outputs distance.
| Value | Edge Detection Mode | measurementDataDistance Output | 
|---|---|---|
| "edge-pair" | Detect edge pairs of the type specified by the
                           | 
 
 
 | 
| "single-edge" | Detect single edges of the type specified by the EdgeTransitionname-value argument. | 
                         | 
Standard deviation for Gaussian smoothing of the 1-D profile data, specified as a positive scalar. Increase this value to increase the amount of Gaussian smoothing and reduce measurement noise at the possible expense of lower accuracy in detecting edge positions.
Geometric transformation for the input image data that defines a 2-D world
              coordinate system, specified as an affinetform2d object, an imref2d object, a rigidtform2d object, a simtform2d
              object, or a transltform2d object.
Output Arguments
Caliper measurement data, returned as a structure with these fields:
| MeasurementDataField | Description | 
|---|---|
| Distance | Distance between the first point of the profile line to the position of each detected edge, stored as a numeric array. | 
| IntraEdgeDistance | Distance between the start and end of each edge pair, stored as a numeric array. | 
| InterEdgeDistance | Distance between the end of an edge pair and the start of the next edge pair, stored as a numeric array. | 
| ProfileData | 1-D profile data that determines detected edges, stored as an M-element numeric vector. M is the integer length of the profile scan, in pixels, and each element of the vector is the mean gradient value at each scan point. | 
| GradientValue | Gradient values corresponding to each edge detection, stored as a row
                      vector or N-by-2 numeric matrix, depending on the value of
                      the  
 
 | 
Extended Capabilities
Usage notes and limitations:
- The - EdgeTransitionand- MeasurementModename-value arguments must be compile-time constants. Code generation does not support cell arrays for these name-value arguments.
Usage notes and limitations:
- The - EdgeTransitionand- MeasurementModename-value arguments must be compile-time constants. Code generation does not support cell arrays for these name-value arguments.
Version History
Introduced in R2025a
See Also
uicaliper | affinetform2d | imref2d | rigidtform2d | simtform2d | transltform2d
MATLAB Command
You clicked a link that corresponds to this MATLAB command:
Run the command by entering it in the MATLAB Command Window. Web browsers do not support MATLAB commands.
Seleccione un país/idioma
Seleccione un país/idioma para obtener contenido traducido, si está disponible, y ver eventos y ofertas de productos y servicios locales. Según su ubicación geográfica, recomendamos que seleccione: .
También puede seleccionar uno de estos países/idiomas:
Cómo obtener el mejor rendimiento
Seleccione China (en idioma chino o inglés) para obtener el mejor rendimiento. Los sitios web de otros países no están optimizados para ser accedidos desde su ubicación geográfica.
América
- América Latina (Español)
- Canada (English)
- United States (English)
Europa
- Belgium (English)
- Denmark (English)
- Deutschland (Deutsch)
- España (Español)
- Finland (English)
- France (Français)
- Ireland (English)
- Italia (Italiano)
- Luxembourg (English)
- Netherlands (English)
- Norway (English)
- Österreich (Deutsch)
- Portugal (English)
- Sweden (English)
- Switzerland
- United Kingdom (English)