Quiver Properties
Quiver chart appearance and behavior
Quiver properties control the appearance and
behavior of a Quiver object. By changing property
values, you can modify certain aspects of the quiver chart. Use dot notation to query
and set properties.
q = quiver(1:10,1:10);
q.Color = 'red';
Arrows
Arrow alignment with respect to the data points, specified as one of the options from this table. The pictures in the table show the data point markers for illustration purposes. By default, the markers do not display.
| Alignment Value | Description | Appearance |
|---|---|---|
| The tails of the arrows are positioned at the data points. |
|
| The shafts of the arrows are centered at the data points. |
|
| The arrow heads are positioned at the data points. |
|


Arrowhead display, specified as 'on' or 'off', or as numeric or logical 1 (true) or 0 (false). A value of 'on' is equivalent to true, and 'off' is equivalent to false. Thus, you can use the value of this property as a logical value. The value is stored as an on/off logical value of type matlab.lang.OnOffSwitchState.
'on'— Display the vectors with arrowheads.'off'— Display the vectors without arrowheads.
Maximum size of arrowhead, specified as a scalar value in units relative to the length of the arrow.
Example: 0.1
Data Types: single | double | int8 | int16 | int32 | int64 | uint8 | uint16 | uint32 | uint64
Since R2024a
This property is read-only.
Arrow scale factor, returned as a scalar. MATLAB® uses this value to scale the arrows in the plot. If the
AutoScale property is "off", the
value of this property is 1.
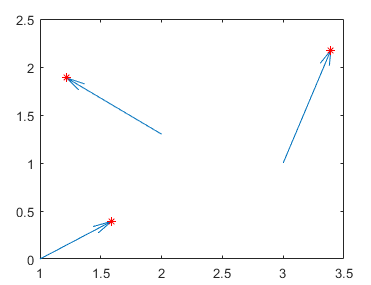
The ScaleFactor property is useful for maintaining
the scale between the arrows and other graphics objects in the axes. For
example, you can position markers at the heads of the arrows.
% Plot three arrows
x = [1 2 3];
y = [0 1.3 1];
u = [1.5 -2 1];
v = [1 1.5 3];
q = quiver(x,y,u,v);
hold on

% Place markers at the tips of the arrows
xp = x + q.ScaleFactor*u;
yp = y + q.ScaleFactor*v;
scatter(xp,yp,"*r")
Difference Between ScaleFactor and AutoScaleFactor
Quiver objects have two properties that determine the lengths of the
arrows: ScaleFactor and
AutoScaleFactor. You can set the
AutoScaleFactor value, but it affects the arrow
lengths only if the AutoScale property is set to
"on". By contrast, the
ScaleFactor is a read-only value.
| Property | Role in Determining Arrow Lengths |
|---|---|
| If the Setting the
|
| Regardless of the automatic scaling and the
value of the |
Automatic scale factor, specified as a scalar. The automatic scale factor is a
multiplier that adjusts the magnitudes of the arrows if the
AutoScale property is "on". For example, a
value of 2 doubles the length of the arrows, and a value of
0.5 halves the length of the arrows.
Note
This property has no effect if the
AutoScaleproperty is set to"off".Adjusting the
AutoScaleFactorproperty updates theScaleFactorproperty.
Use the automatic scale factor to adjust arrow length, specified as
'on' or 'off', or as numeric or logical
1 (true) or 0
(false). A value of 'on' is equivalent to
true, and 'off' is equivalent to
false. Thus, you can use the value of this property as a logical
value. The value is stored as an on/off logical value of type matlab.lang.OnOffSwitchState.
'on'— Use theAutoScaleFactorvalue as a secondary multiplier to scale the arrow lengths to fit within the grid-defined coordinate data and scale arrows so that they do not overlap.'off'— Do not scale the arrow lengths.
Sharp vertical and horizontal lines, specified as 'on' or
'off', or as numeric or logical 1
(true) or 0 (false). A
value of 'on' is equivalent to true, and 'off' is
equivalent to false. Thus, you can use the value of this property as
a logical value. The value is stored as an on/off logical value of type matlab.lang.OnOffSwitchState.
| Value | Description | Appearance |
|---|---|---|
'on' | Sharpen vertical and horizontal lines to eliminate an uneven appearance. |
|
'off' | Do not sharpen vertical or horizontal lines. The lines might appear uneven in thickness or color. |
|


Color and Styling
Arrow color, specified as a three-element RGB triplet, a hexadecimal color code, a color name, or a short name.
For a custom color, specify an RGB triplet or a hexadecimal color code.
An RGB triplet is a three-element row vector whose elements specify the intensities of the red, green, and blue components of the color. The intensities must be in the range
[0,1], for example,[0.4 0.6 0.7].A hexadecimal color code is a string scalar or character vector that starts with a hash symbol (
#) followed by three or six hexadecimal digits, which can range from0toF. The values are not case sensitive. Therefore, the color codes"#FF8800","#ff8800","#F80", and"#f80"are equivalent.
Alternatively, you can specify some common colors by name. This table lists the named color options, the equivalent RGB triplets, and the hexadecimal color codes.
| Color Name | Short Name | RGB Triplet | Hexadecimal Color Code | Appearance |
|---|---|---|---|---|
"red" | "r" | [1 0 0] | "#FF0000" |
|
"green" | "g" | [0 1 0] | "#00FF00" |
|
"blue" | "b" | [0 0 1] | "#0000FF" |
|
"cyan"
| "c" | [0 1 1] | "#00FFFF" |
|
"magenta" | "m" | [1 0 1] | "#FF00FF" |
|
"yellow" | "y" | [1 1 0] | "#FFFF00" |
|
"black" | "k" | [0 0 0] | "#000000" |
|
"white" | "w" | [1 1 1] | "#FFFFFF" |
|
"none" | Not applicable | Not applicable | Not applicable | No color |
This table lists the default color palettes for plots in the light and dark themes.
| Palette | Palette Colors |
|---|---|
Before R2025a: Most plots use these colors by default. |
|
|
|
You can get the RGB triplets and hexadecimal color codes for these palettes using the orderedcolors and rgb2hex functions. For example, get the RGB triplets for the "gem" palette and convert them to hexadecimal color codes.
RGB = orderedcolors("gem");
H = rgb2hex(RGB);
Before R2023b: Get the RGB triplets using RGB =
get(groot,"FactoryAxesColorOrder").
Before R2024a: Get the hexadecimal color codes using H =
compose("#%02X%02X%02X",round(RGB*255)).
Example: 'blue'
Example: [0 0 1]
Style of arrow stem, specified as one of the line styles listed in this table.
| Line Style | Description | Resulting Line |
|---|---|---|
"-" | Solid line |
|
"--" | Dashed line |
|
":" | Dotted line |
|
"-." | Dash-dotted line |
|
"none" | No line | No line |
Width of arrow lines, specified as a positive value in point units. One point equals
1/72 inch. The default value is 0.5
point.
Series index, specified as a positive whole number or "none". This
property is useful for reassigning the colors, line styles, or markers of
Quiver objects so that they match other objects.
By default, the SeriesIndex property is a number that corresponds
to the order in which the Quiver object was created, starting at
1. MATLAB uses the number to calculate indices for automatically assigning color,
line style, or markers when you call plotting functions. The indices refer to the rows
of the arrays stored in the ColorOrder and
LineStyleOrder properties of the axes. Any objects in the axes
that have the same SeriesIndex number also have the same color (and
line style and markers, if applicable).
A SeriesIndex value of "none" corresponds to a
solid line with a neutral color that does not participate in the indexing scheme.
How Manually Setting Colors, Line Styles, or Markers Overrides SeriesIndex Behavior
To manually control the color, line style, and markers, set the
Color, LineStyle, and
Marker properties of the Quiver
object.
When you manually set these properties of an object, MATLAB disables automatic color, line style, and marker selection for that
object and allows your selection to persist, regardless of the value of the
SeriesIndex property. The ColorMode,
LineStyleMode, and MarkerMode
properties indicate whether the colors, line styles, and markers have been set
manually (by you) or automatically. For each of these mode properties, a value of
"manual" indicates manual selection, and a value of
"auto" indicates automatic selection.
To enable automatic selection again, set the ColorMode,
LineStyleMode, MarkerMode, or all
three properties to "auto", and set the
SeriesIndex property to a positive whole number.
In some cases, MATLAB sets the SeriesIndex property to
0, which also disables automatic selection.
Markers
Marker symbol, specified as one of the values listed in this table. By default, the object does not display markers. Specifying a marker symbol adds markers at each data point or vertex.
| Marker | Description | Resulting Marker |
|---|---|---|
"o" | Circle |
|
"+" | Plus sign |
|
"*" | Asterisk |
|
"." | Point |
|
"x" | Cross |
|
"_" | Horizontal line |
|
"|" | Vertical line |
|
"square" | Square |
|
"diamond" | Diamond |
|
"^" | Upward-pointing triangle |
|
"v" | Downward-pointing triangle |
|
">" | Right-pointing triangle |
|
"<" | Left-pointing triangle |
|
"pentagram" | Pentagram |
|
"hexagram" | Hexagram |
|
"none" | No markers | Not applicable |
Alternatively, you can specify some common colors by name. This table lists the named color options, the equivalent RGB triplets, and the hexadecimal color codes.
| Color Name | Short Name | RGB Triplet | Hexadecimal Color Code | Appearance |
|---|---|---|---|---|
"red" | "r" | [1 0 0] | "#FF0000" |
|
"green" | "g" | [0 1 0] | "#00FF00" |
|
"blue" | "b" | [0 0 1] | "#0000FF" |
|
"cyan"
| "c" | [0 1 1] | "#00FFFF" |
|
"magenta" | "m" | [1 0 1] | "#FF00FF" |
|
"yellow" | "y" | [1 1 0] | "#FFFF00" |
|
"black" | "k" | [0 0 0] | "#000000" |
|
"white" | "w" | [1 1 1] | "#FFFFFF" |
|
"none" | Not applicable | Not applicable | Not applicable | No color |
This table lists the default color palettes for plots in the light and dark themes.
| Palette | Palette Colors |
|---|---|
Before R2025a: Most plots use these colors by default. |
|
|
|
You can get the RGB triplets and hexadecimal color codes for these palettes using the orderedcolors and rgb2hex functions. For example, get the RGB triplets for the "gem" palette and convert them to hexadecimal color codes.
RGB = orderedcolors("gem");
H = rgb2hex(RGB);
Before R2023b: Get the RGB triplets using RGB =
get(groot,"FactoryAxesColorOrder").
Before R2024a: Get the hexadecimal color codes using H =
compose("#%02X%02X%02X",round(RGB*255)).