Persistence Spectrum in Signal Analyzer
The persistence spectrum is a time-frequency view that shows the percentage of the time that a given frequency is present in a signal. The persistence spectrum is a histogram in power-frequency space. The longer a particular frequency persists in a signal as the signal evolves, the higher its time percentage and thus the brighter or "hotter" its color in the display. Use the persistence spectrum in Signal Analyzer to identify signals hidden in other signals.
To compute the persistence spectrum, Signal Analyzer performs these steps:
Compute the spectrogram using the specified leakage, time resolution, and overlap. (When you zoom in time using the panner or a zoom button, the app computes and displays the persistence spectrum using the segments that fall within the visible zoomed-in region of interest, including those segments that are only partially visible. For more details, see Spectrogram Computation in Signal Analyzer.)
Partition the power and frequency values into 2-D bins. (To adjust the power or the frequency limits, enter the minimum and maximum Power Limits or Frequency Limits values on the Persistence Spectrum tab.)
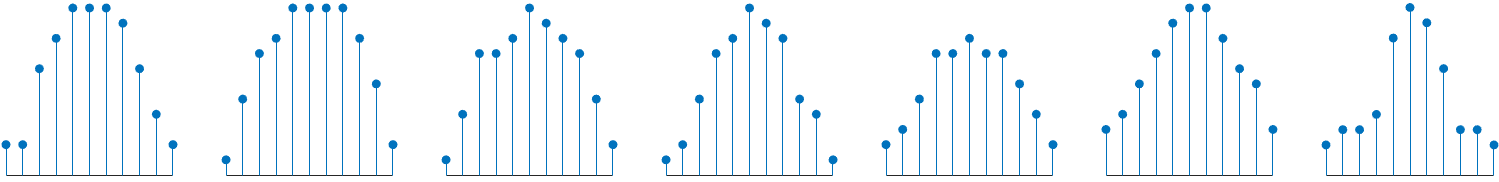
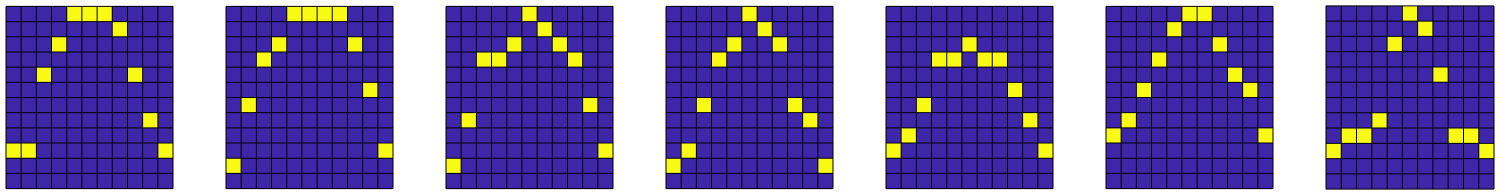
For each time value, compute a bivariate histogram of the logarithm of the power spectrum. For every power-frequency bin where there is signal energy at that instant, increase the corresponding matrix element by 1. Sum the histograms for all the time values.
Plot the accumulated histogram against the power and the frequency, with the color proportional to the logarithm of the histogram counts expressed as normalized percentages. To represent zero values, use one-half of the smallest possible magnitude.
(To adjust the range of histogram counts represented in the colormap, enter the minimum and maximum Density Limits on the Persistence Spectrum tab. To fit the colormap to the current density limits, click the Fit colormap button on the Display tab.)
| Power Spectra |
|
| Histograms |
|
| Accumulated Histogram |
|

See Also
Apps
Functions
Topics
- Resolve Tones by Varying Window Leakage
- Extract Voices from Music Signal
- Find Interference Using Persistence Spectrum
- Find and Track Ridges Using Reassigned Spectrogram
- Compute Envelope Spectrum of Vibration Signal
- Spectrum Computation in Signal Analyzer
- Spectrogram Computation in Signal Analyzer
- Scalogram Computation in Signal Analyzer
- Keyboard Shortcuts for Signal Analyzer