closestProjections
Encuentre proyecciones ortogonales entre el vector tangente de ruta y el punto de consulta
Desde R2022a
Sintaxis
Descripción
[ intenta proyectar cada punto xy de la matriz points sobre cada segmento clotoide contenido en la ruta de referencia, arclengths,distances] = closestProjections(refPath,points)refPath, de modo que el vector de proyección sea ortogonal al ángulo tangente de la ruta. Devuelve la proyección ortogonal más cercana entre la curva y el punto de consulta en cada segmento como un par de dos arreglos de celdas, arclengths y distances, que contienen las longitudes de arco y las distancias respectivamente.
[___, devuelve opcionalmente los puntos proyectados, projPoints] = closestProjections(refPath,points)projPoints como un arreglo de celdas que contiene datos de ruta evaluados en el elemento de longitud de arco correspondiente.
Ejemplos
Cree una ruta de referencia con múltiples intersecciones.
leftSideAngles  = [linspace(-pi/6,pi/6,4) linspace(pi/6,-pi/6,4)]';
rightSideAngles = [linspace(-pi/6,pi/6,4) linspace(-pi/6,pi/6,4)]';
waypoints = zeros(numel(leftSideAngles)*2,3);
width = 10;
height = 20;
waypoints(1:2:end,:) = [zeros(numel(leftSideAngles),1) linspace(0,height,numel(leftSideAngles))' leftSideAngles]; ...
                        waypoints(2:2:end,:) = [width*ones(numel(leftSideAngles),1) linspace(0,height,numel(leftSideAngles))' rightSideAngles];
refPath = referencePathFrenet(waypoints);
Crea un conjunto de puntos XY aleatorios alrededor de la ruta.
queryPoints = [width height]/2+(rand(10,2)-.5).*[width height]*1.5;
Recupere la proyección válida más cercana de cada punto de consulta en cada segmento de la ruta.
[allArclenth,allDistance,allProjection] = closestProjections(refPath,queryPoints);
pLength = refPath.PathLength;
breaks = [refPath.SegmentParameters(:,end); pLength];
allInterval = [breaks(1:end) [breaks(2:end); pLength]];
Devuelve las tres mejores proyecciones.
maxResult = 3;
[best3Arclength,best3Distance,best3Projection] = closestProjections(refPath,queryPoints,maxResult);
Defina un conjunto personalizado de intervalos de longitud de arco.
everyThreeMerged = [breaks(1:3:end-1) [breaks(4:3:end-1); breaks(end)]];
Encuentre la mejor proyección de cada punto de consulta en cada intervalo personalizado que exista.
[allArclengthCustom,allDistanceCustom,allProjectionCustom] = closestProjections(refPath,queryPoints,everyThreeMerged);
Devuelve la mejor proyección en el primer y último cuarto de la ruta.
endQuarterIntervals = [0 1/4; 3/4 1]*refPath.PathLength;
[bestQuarterArclength,bestQuarterDistance,bestQuarterProjection] = closestProjections(refPath,queryPoints,endQuarterIntervals, 1);
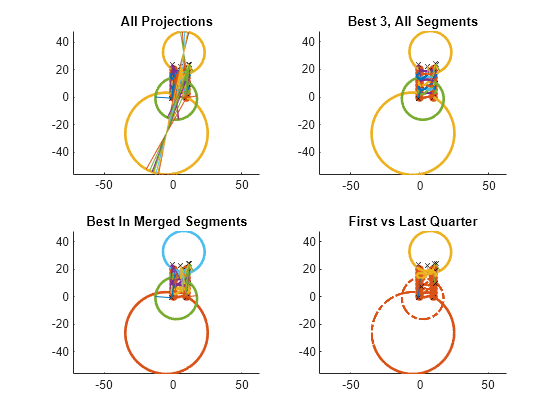
Mostrar los resultados.
% Pack iterable containers
intervalSets = {allInterval, allInterval, everyThreeMerged, endQuarterIntervals};
S = {allArclenth best3Arclength allArclengthCustom bestQuarterArclength};
D = {allDistance best3Distance allDistanceCustom bestQuarterDistance};
PP = {allProjection best3Projection allProjectionCustom bestQuarterProjection};
titles = ["All Projections","Best 3, All Segments","Best In Merged Segments","First vs Last Quarter"];
cOrder = colororder;
Defina las funciones auxiliares.
mergeFcn = @(v1,v2)reshape([v1 v2 nan(size(v1,1),size(v2,2))]',[],1);
plotFcn = @(L1,L2,linespec)plot(mergeFcn(L1(:,1),L2(:,1:min(1,size(L2,2)))),mergeFcn(L1(:,2),L2(:,2:min(2,size(L2,2)))),linespec{:});
intervalPlotter = @(bounds,nPt,linespec)plotFcn(interpolate(refPath,linspace(bounds(1),bounds(2),nPt)'),[],linespec);
Cree identificadores en bucle.
setupFcns = {};
setupFcns{1} = @(figIdx)hold(show(refPath,"Parent",subplot(2,2,figIdx)),"on");
setupFcns{2} = @(figIdx)axis(subplot(2,2,figIdx),"equal");
setupFcns{3} = @(figIdx)title(subplot(2,2,figIdx),titles(figIdx));
setupFcns{4} = @(figIdx)plotFcn(queryPoints,[],{"Xk","MarkerSize",5});
setupFcns{5} = @(figIdx)arrayfun(@(i)intervalPlotter(intervalSets{figIdx}(i,:),100,{"Color",cOrder(mod(i,size(cOrder,1)-1)+1,:),"LineWidth",2'}),1:size(intervalSets{figIdx},1));
setupFcns{6} = @(figIdx)cellfun(@(p,projPts)plotFcn(repmat(queryPoints(p,:),size(projPts,1),1),projPts,{"Color",cOrder(mod(p,size(cOrder,1)-1)+1,:)}),num2cell(1:size(queryPoints,1))',PP{figIdx});
Mostrar los resultados.
arrayfun(@(idx)cellfun(@(f)f(idx),setupFcns),1:4)
Argumentos de entrada
Argumentos de salida
Capacidades ampliadas
Historial de versiones
Introducido en R2022a